Climate change is a long-term change in average temperature and weather patterns over years, which impacts us all.
On this page:
What is climate change?
Climate change is a long-term change in average temperature and weather patterns. It can be measured across regional and global scales and across thousands of years. Climate change impacts every part of Victoria’s water management.
Implications of climate change for Victorian water management include:
more intense downpours, with greater risk of flash flooding in urban areas
decline in alpine snowfall, reducing tourism opportunities in ski fields and water melt that flows into catchments
decline in rainfall particularly during the cool season (May to October)
shift the resilience of dry land agriculture and runoff into farm dams and waterways
less water in waterways to keep them healthy
less available groundwater
increased reliance on climate-independent water sources (desalination and recycling)
rising sea levels causing erosion
double the number of very hot days
longer fire seasons
loss of flora and fauna.
Essentially, there is much less rainfall and less water entering streams, rivers and our water storages at the right time of year.
Looking forward and looking back
Victoria’s growing population also means higher demand for water throughout the year. Changes to weather patterns may result in availability of water being less reliable.
This can make it more difficult to meet different demands, such as for towns, farms and others. Understanding the causes and impacts of these changes helps Victorians prepare and better plan mitigation and adaption strategies.
Climate change can also change how Victoria experiences damaging weather events (drought, flooding, storms). For example, the Millennium Drought (1996–2010) saw unprecedented dry conditions.
At this time, many of Victoria’s storages and lakes reached their lowest level or were empty. For some people, this meant shorter showers.
But for others it meant the difference to feeding livestock and growing crops. Because of this and much more, all Victorian water corporations must produce a climate change action plan.
The State of the Climate Report (released by the Bureau of Meteorology in partnership with the CSIRO) draws on the latest national and international climate research, monitoring, science and projection information.
It is released every 2 years and describes changes and long-term trends in Australia’s climate.
Sandra Dharmadi is a Senior Policy Officer with the Department of Energy, Environment and Climate Action (DEECA). Here she discusses her work studying Victoria's changing climate and how it helps inform how we manage water.
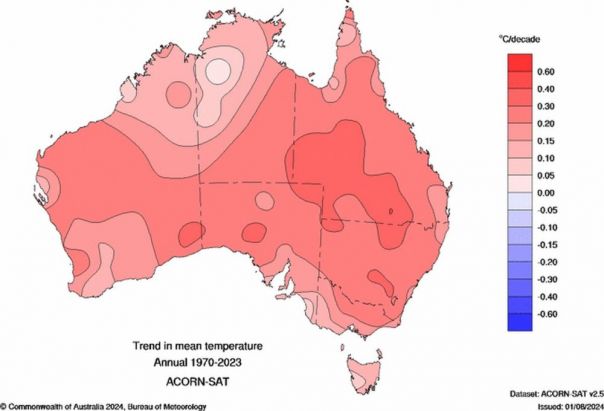
A Bureau of Meteorology (BOM) map of Australia showing trend in mean temperature for 1970 to 2023. Map shows the entire county covered in large red patches showing 0.05 to 0.60 Celsius degrees change.Image credit: Bureau of Meteorology
-
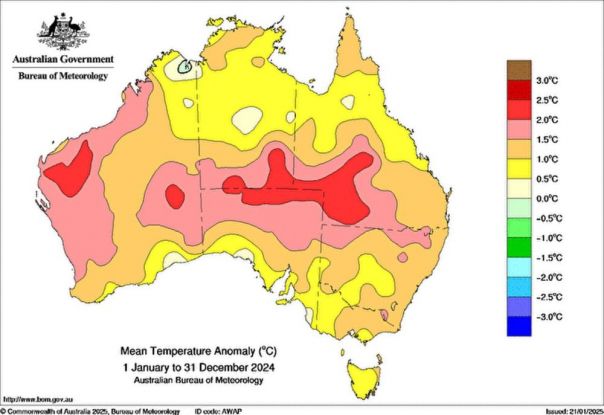
A Bureau of Meteorology map of Australia showing mean temperature anomaly for 1 January to 31 December 2024. Large red patches demonstrate a change of 1.5 to 3 degrees. Larger yellow patches show a change of 0.5 to 1.5 degrees.Image credit: Bureau of Meteorology
-
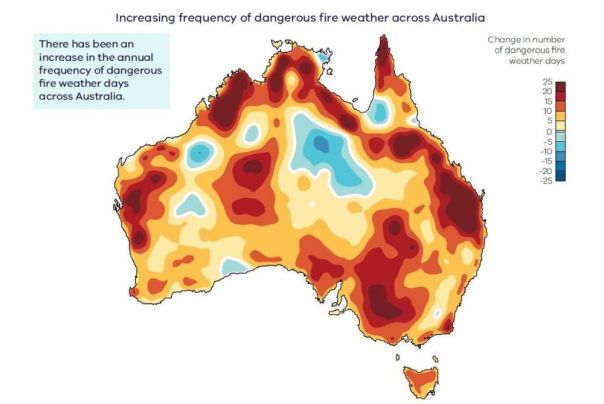
Taken from the Victoria's Climate Science Report 2024, this map shows an increased frequency in dangerous fire weather across Australia with large patches of red and orange showing an increase of 0 to 25 dangerous weather days in the periods of July 1950 to June 1986 and July 1986 to June 2022.Image credit: DEECA
-
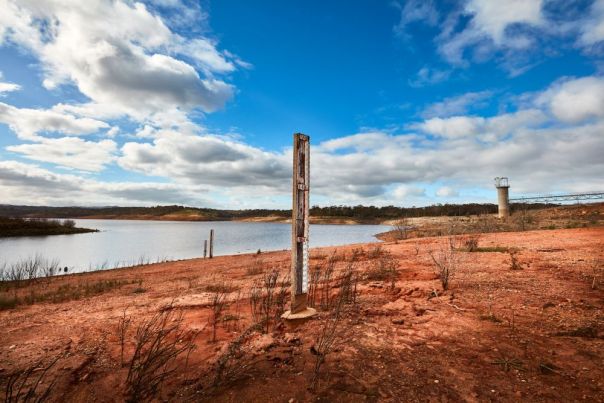
A reservoir height gauge in Victoria's western region sits above a dry lake-bed of dry, red earth. This gauge shows how high water can get and how little water was to be found there around 2016.Image credit: DEECA and Craig Moodie
-
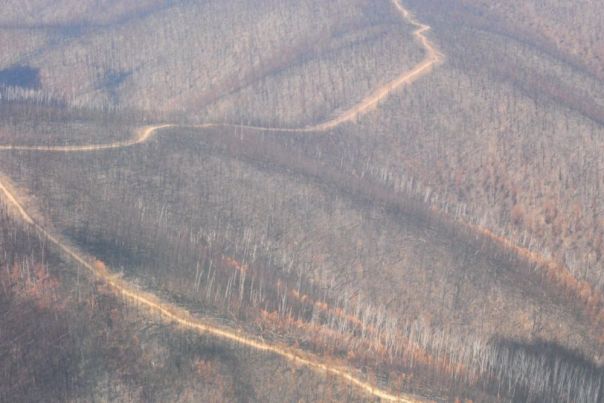
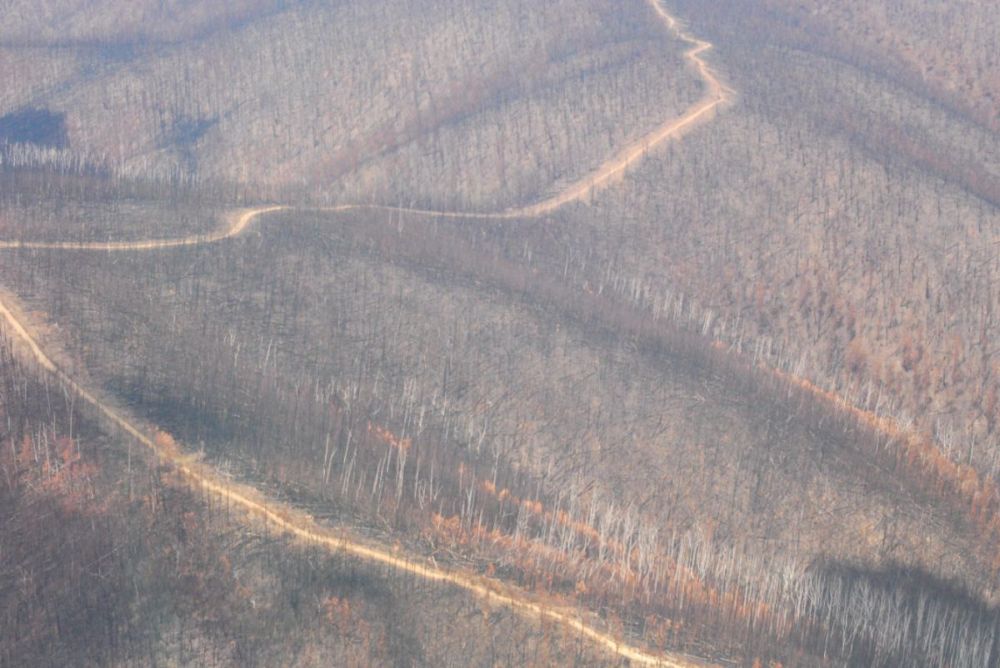
Large expanses of hillside trees burnt by bushfire in early 2020. Climate change can add to the risk of fire with more fuel and less rain falling when it is needed.Image credit: DEECA
-
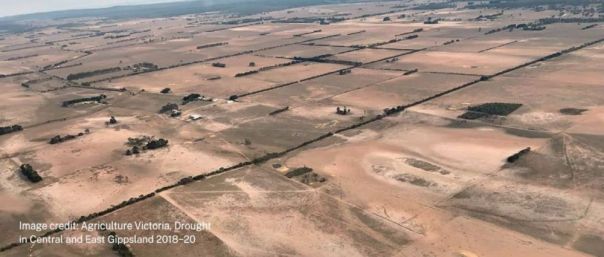
Drought-stricken farmland in Central and East Gippsland from 2018 to 2020.Image credit: Agriculture Victoria
-
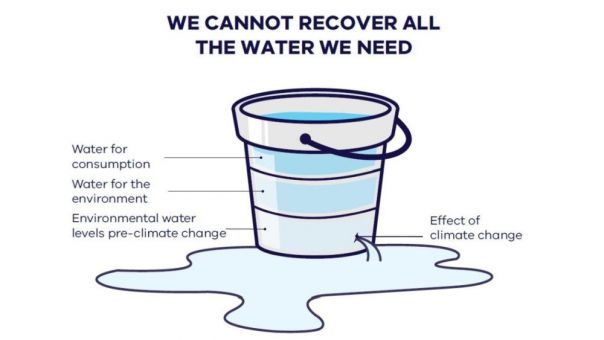
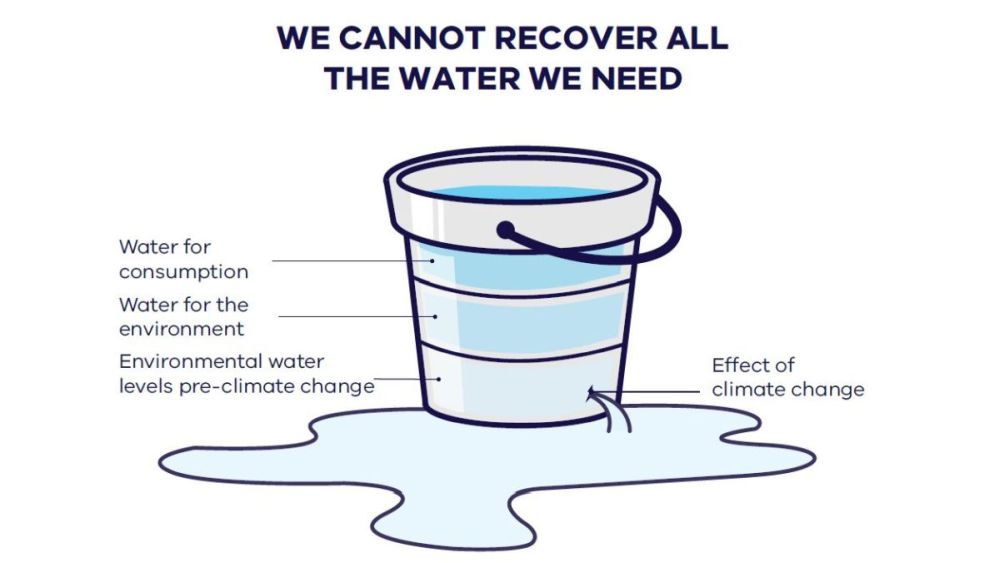
From the Central and Gippsland Region Sustainable Water Strategy, this infographic of a bucket represents how much water Victoria has. It is divided into water for consumption, water for the environment, and environmental levels pre-climate change. The bucket has a hole leaking water reflecting the effect of climate change including things like evaporation and reduction in streamflow.Image credit: DEECA
-
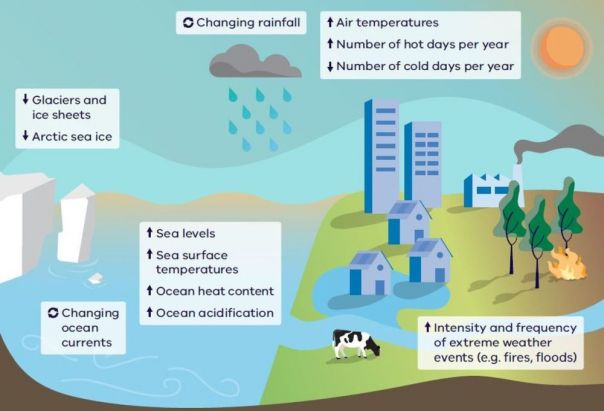
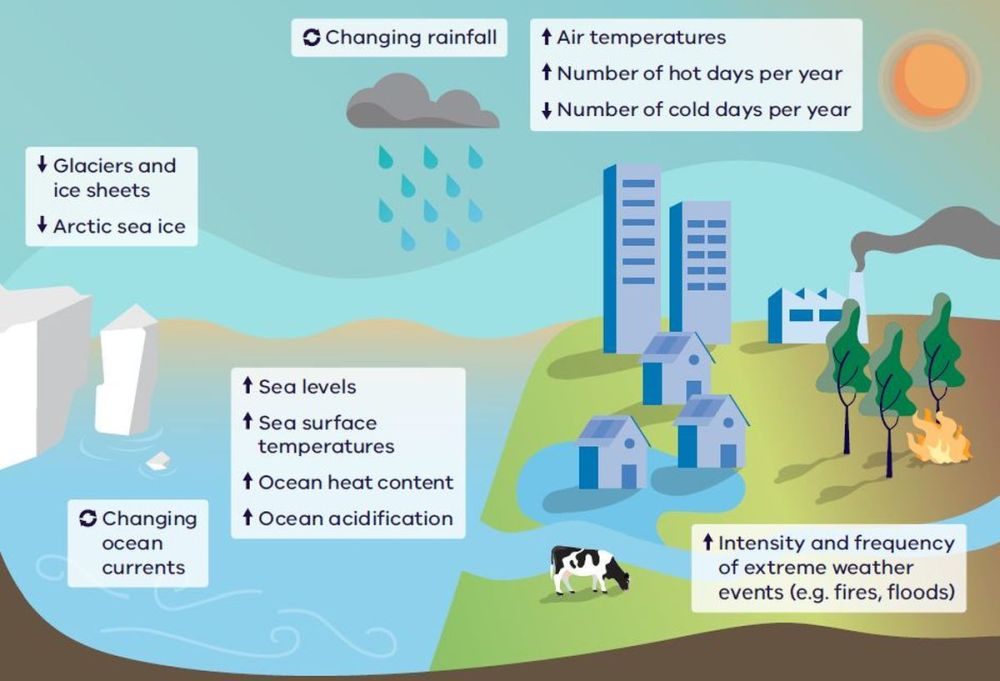
Taken from the Victoria's Climate Science Report 2024, this infographic explains how climate change evolves. This includes the melting of glaciers and ice sheets with a rise in sea levels and a change in ocean currents. On land, climate change affects air temperatures and the numbers of hot and cold days as well as the intensity and frequency of extreme weather events like fires and floods.Image credit: DEECA
-
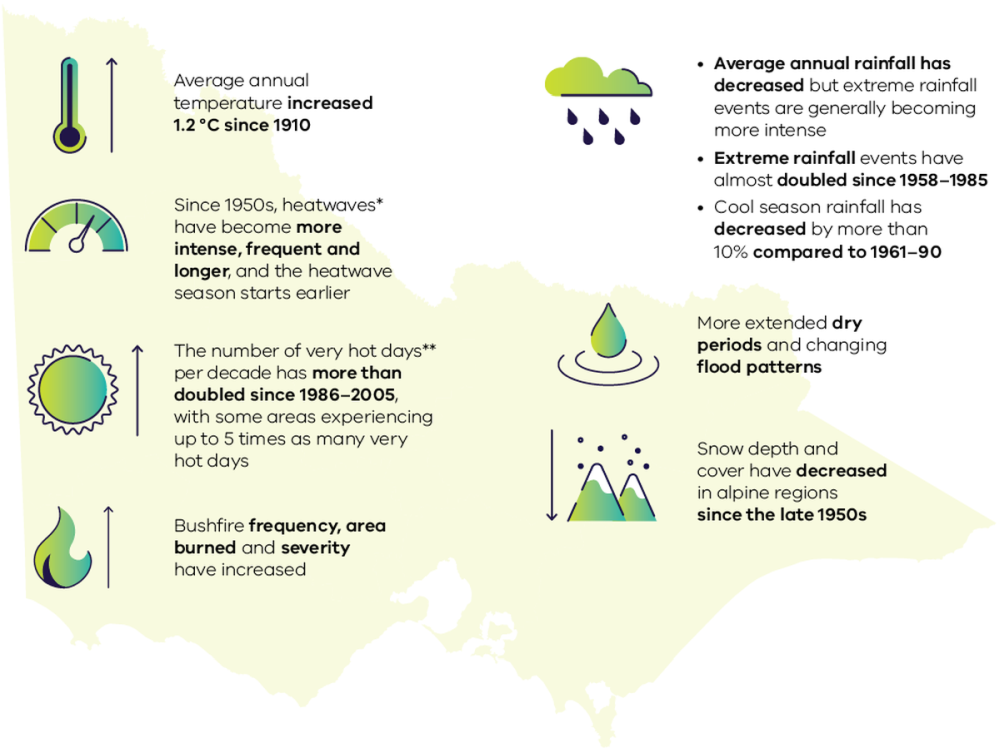
Taken from the Victoria's Climate Science Report 2024, this infographic explains how Victoria's climate has already changed as a result of climate change. These include an average annual temperate increase of 1.2 degrees since 1910, more frequence and intense heatwaves, increased severity and frequency of bushfires, a decrease in annual rainfall with extreme rainfall events having doubled, more extended dry periods and a decrease in alpine region snow depths.Image credit: DEECA
-
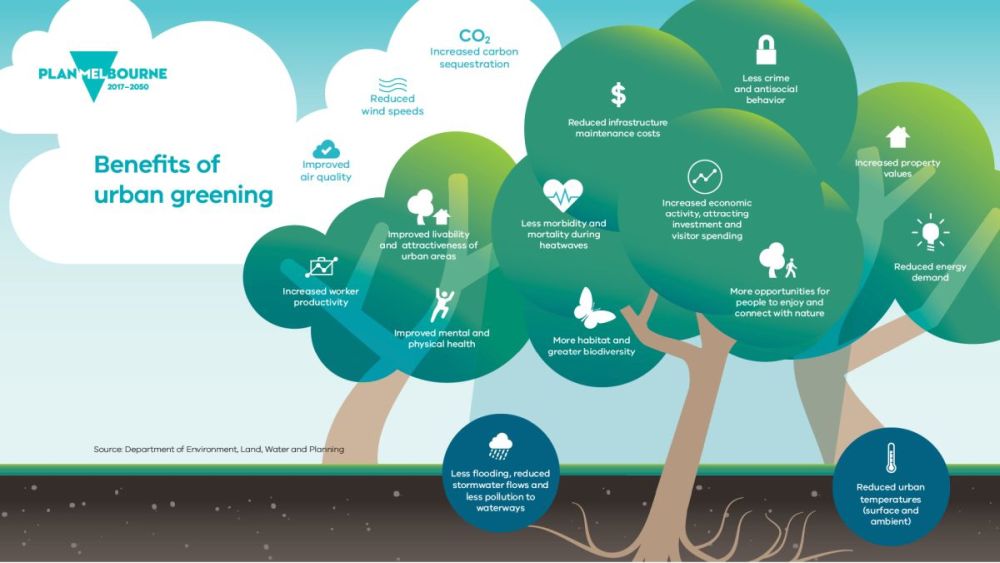
Taken from the Plan Melbourne 2017–2050 Strategy, this infographic explains the benefits of urban greening. These include improved air quality and an increase in carbon sequestration, improved liveability, habitat and biodiversity, reduced demand for energy consumption, and improved mental health.Image credit: Department of Transport and Planning
A Bureau of Meteorology (BOM) map of Australia showing trend in mean temperature for 1970 to 2023. Map shows the entire county covered in large red patches showing 0.05 to 0.60 Celsius degrees change.
Image credit: Bureau of Meteorology
A Bureau of Meteorology map of Australia showing mean temperature anomaly for 1 January to 31 December 2024. Large red patches demonstrate a change of 1.5 to 3 degrees. Larger yellow patches show a change of 0.5 to 1.5 degrees.
Image credit: Bureau of Meteorology
Taken from the Victoria's Climate Science Report 2024, this map shows an increased frequency in dangerous fire weather across Australia with large patches of red and orange showing an increase of 0 to 25 dangerous weather days in the periods of July 1950 to June 1986 and July 1986 to June 2022.
Image credit: DEECA
A reservoir height gauge in Victoria's western region sits above a dry lake-bed of dry, red earth. This gauge shows how high water can get and how little water was to be found there around 2016.
Image credit: DEECA and Craig Moodie
Large expanses of hillside trees burnt by bushfire in early 2020. Climate change can add to the risk of fire with more fuel and less rain falling when it is needed.
Image credit: DEECA
Drought-stricken farmland in Central and East Gippsland from 2018 to 2020.
Image credit: Agriculture Victoria
From the Central and Gippsland Region Sustainable Water Strategy, this infographic of a bucket represents how much water Victoria has. It is divided into water for consumption, water for the environment, and environmental levels pre-climate change. The bucket has a hole leaking water reflecting the effect of climate change including things like evaporation and reduction in streamflow.
Image credit: DEECA
Taken from the Victoria's Climate Science Report 2024, this infographic explains how climate change evolves. This includes the melting of glaciers and ice sheets with a rise in sea levels and a change in ocean currents. On land, climate change affects air temperatures and the numbers of hot and cold days as well as the intensity and frequency of extreme weather events like fires and floods.
Image credit: DEECA
Taken from the Victoria's Climate Science Report 2024, this infographic explains how Victoria's climate has already changed as a result of climate change. These include an average annual temperate increase of 1.2 degrees since 1910, more frequence and intense heatwaves, increased severity and frequency of bushfires, a decrease in annual rainfall with extreme rainfall events having doubled, more extended dry periods and a decrease in alpine region snow depths.
Image credit: DEECA
Taken from the Plan Melbourne 2017–2050 Strategy, this infographic explains the benefits of urban greening. These include improved air quality and an increase in carbon sequestration, improved liveability, habitat and biodiversity, reduced demand for energy consumption, and improved mental health.
Image credit: Department of Transport and Planning
Further resources
Below you can find a variety of resources to further research on improving understanding of climate change in Victoria.