On this page:
Maintaining affordability requires a modern, innovative and efficient water service. By collaborating with the community and focusing on the future, the water sector can strike the balance between price and service. This will benefit everyone.
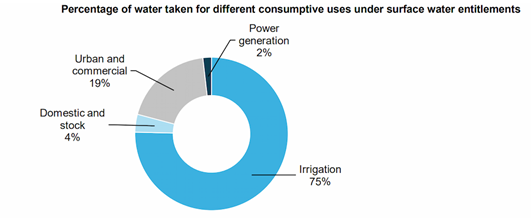
Percentage of water taken for different consumptive uses under surface water entitlements
Promoting a financially sustainable and transparent water industry
By giving you transparent and comparative financial information, the government is making sure that the water sector is keeping costs down.
Each water corporation’s annual report is available on their webpage.
As an example of general operational performance of the business an EBITDA - which includes earnings before interest, tax, depreciation and amortisation - of above 0% indicates an ability to generate surplus, to fund operations and to deliver asset renewal.
EBITDA % (Earning before interest, tax, depreciation and amortisation/total revenue*100)
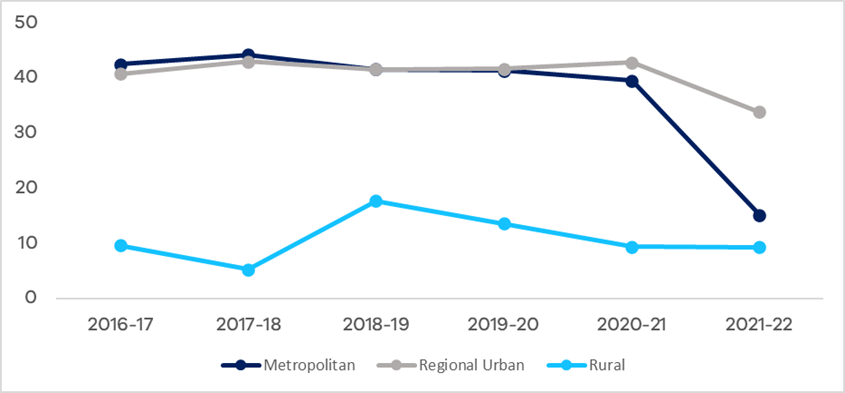
Note: The drop in Metro EBITDA in 2021-22 is partly due to the integration of City West Water and Western Water (WW) to form Greater Western Water (GWW) which resulted in a write-down of WW’s infrastructure asset value of approximately $703.0 million.
More explanation can be found in GWW’s 2021-22 annual report.
Page 21 notes: “The valuation write-down is a non-cash accounting book adjustment, required by the Australian Accounting Standards for measuring the fair value of infrastructure assets which differs between Not for Profit entities such as WW and for Profit entities such as CWW.
The nature of WW’s infrastructure assets and their service delivery do not change as a result of the adjustment. Importantly, there is no resulting impact to customers or pricing”.
Page last updated: 19/11/24