On this page:
The status of the state’s water resources across various categories, including storage levels, rainfall and seasonal outlooks.
Water storage levels
As at 15 July 2026, total combined storage levels for major Melbourne, regional and statewide storage networks were as follows:
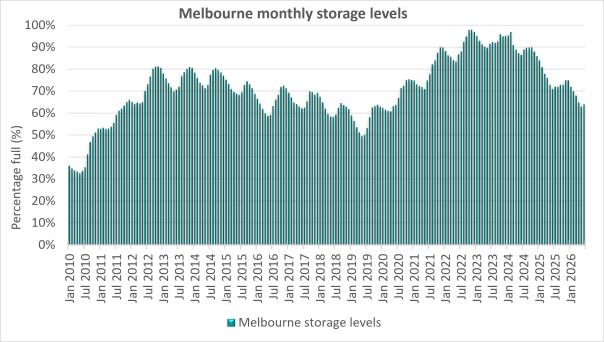
- Melbourne: 65% full (7% lower than the previous year).
- Regional: 57% full (2% higher than the previous year).
- Statewide: 58% full (the same as the previous year).
Metro Melbourne water storage levels
Northern Victoria water storage levels
* Victoria has a 50% share of inflows to Dartmouth and in Hume
Southern and Western Victoria water storage levels
* Werribee Basin storage value is the combined volume of the Melton, Merrimu and Pykes reservoirs
Download the monthly dataset
Updated 16 July 2026. The next update is in mid-August 2026.
Regional, Melbourne and all Victoria monthly storage levels

- Regional monthly storage levels - end January 2010 to end June 2026
- Melbourne monthly storage levels - end January 2010 to end June 2026

- Total Victorian monthly storage levels - end January 2010 to end June 2026
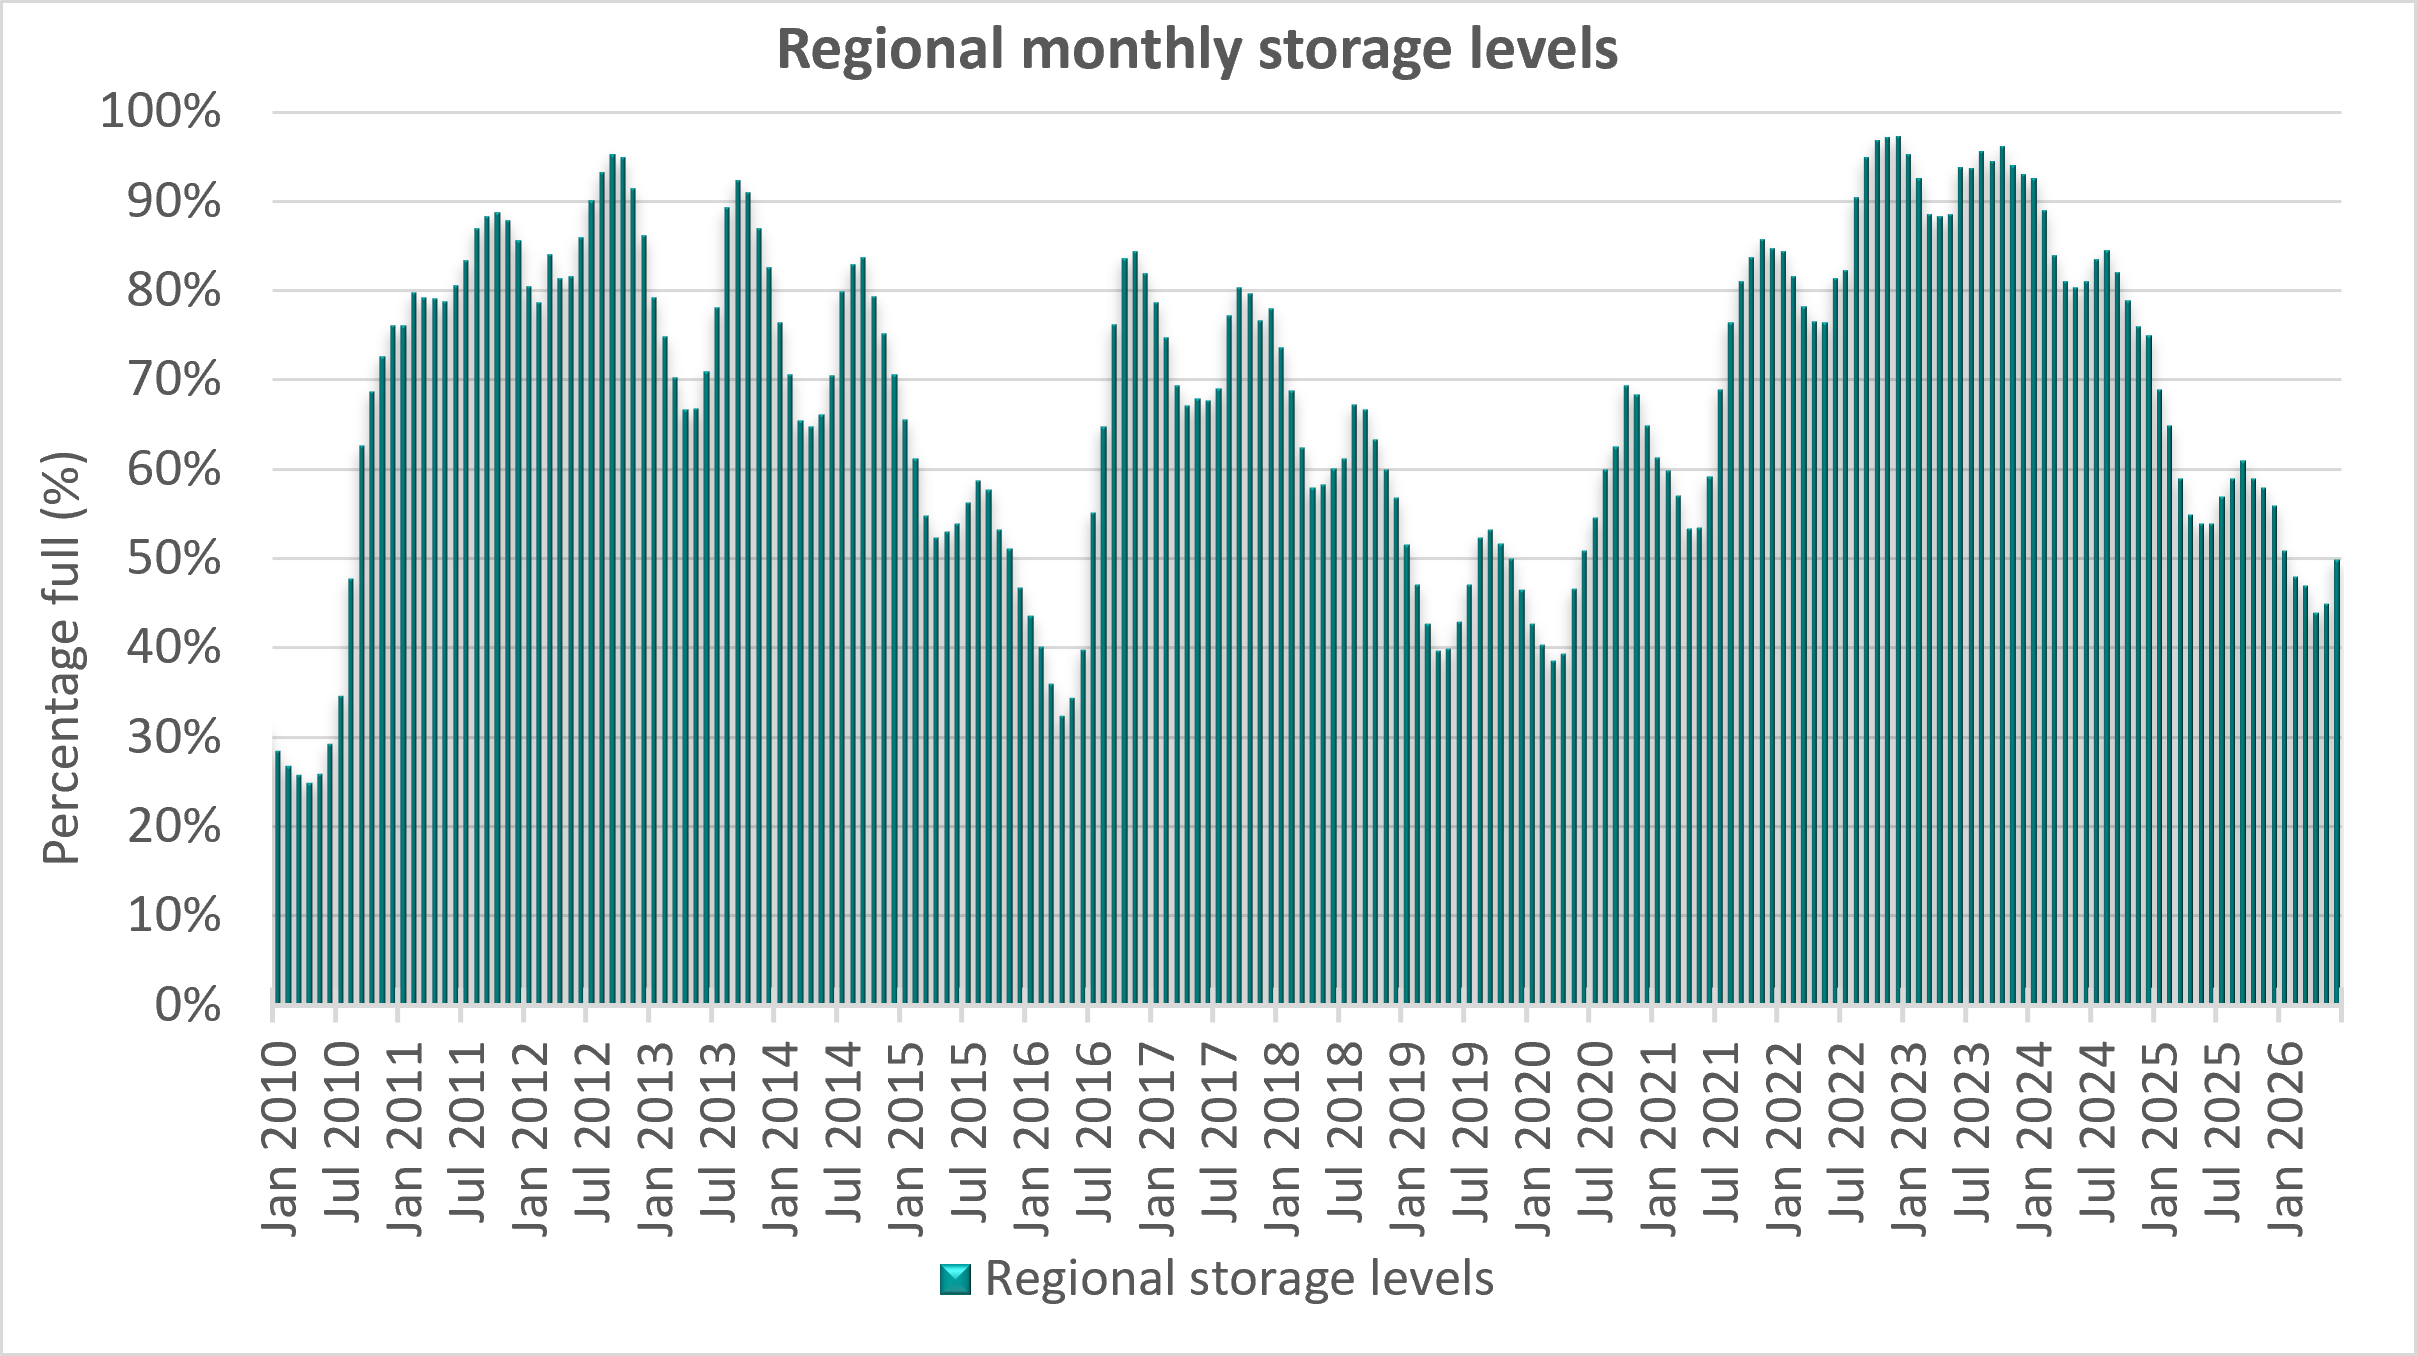
Regional monthly storage levels - end January 2010 to end June 2026

Melbourne monthly storage levels - end January 2010 to end June 2026
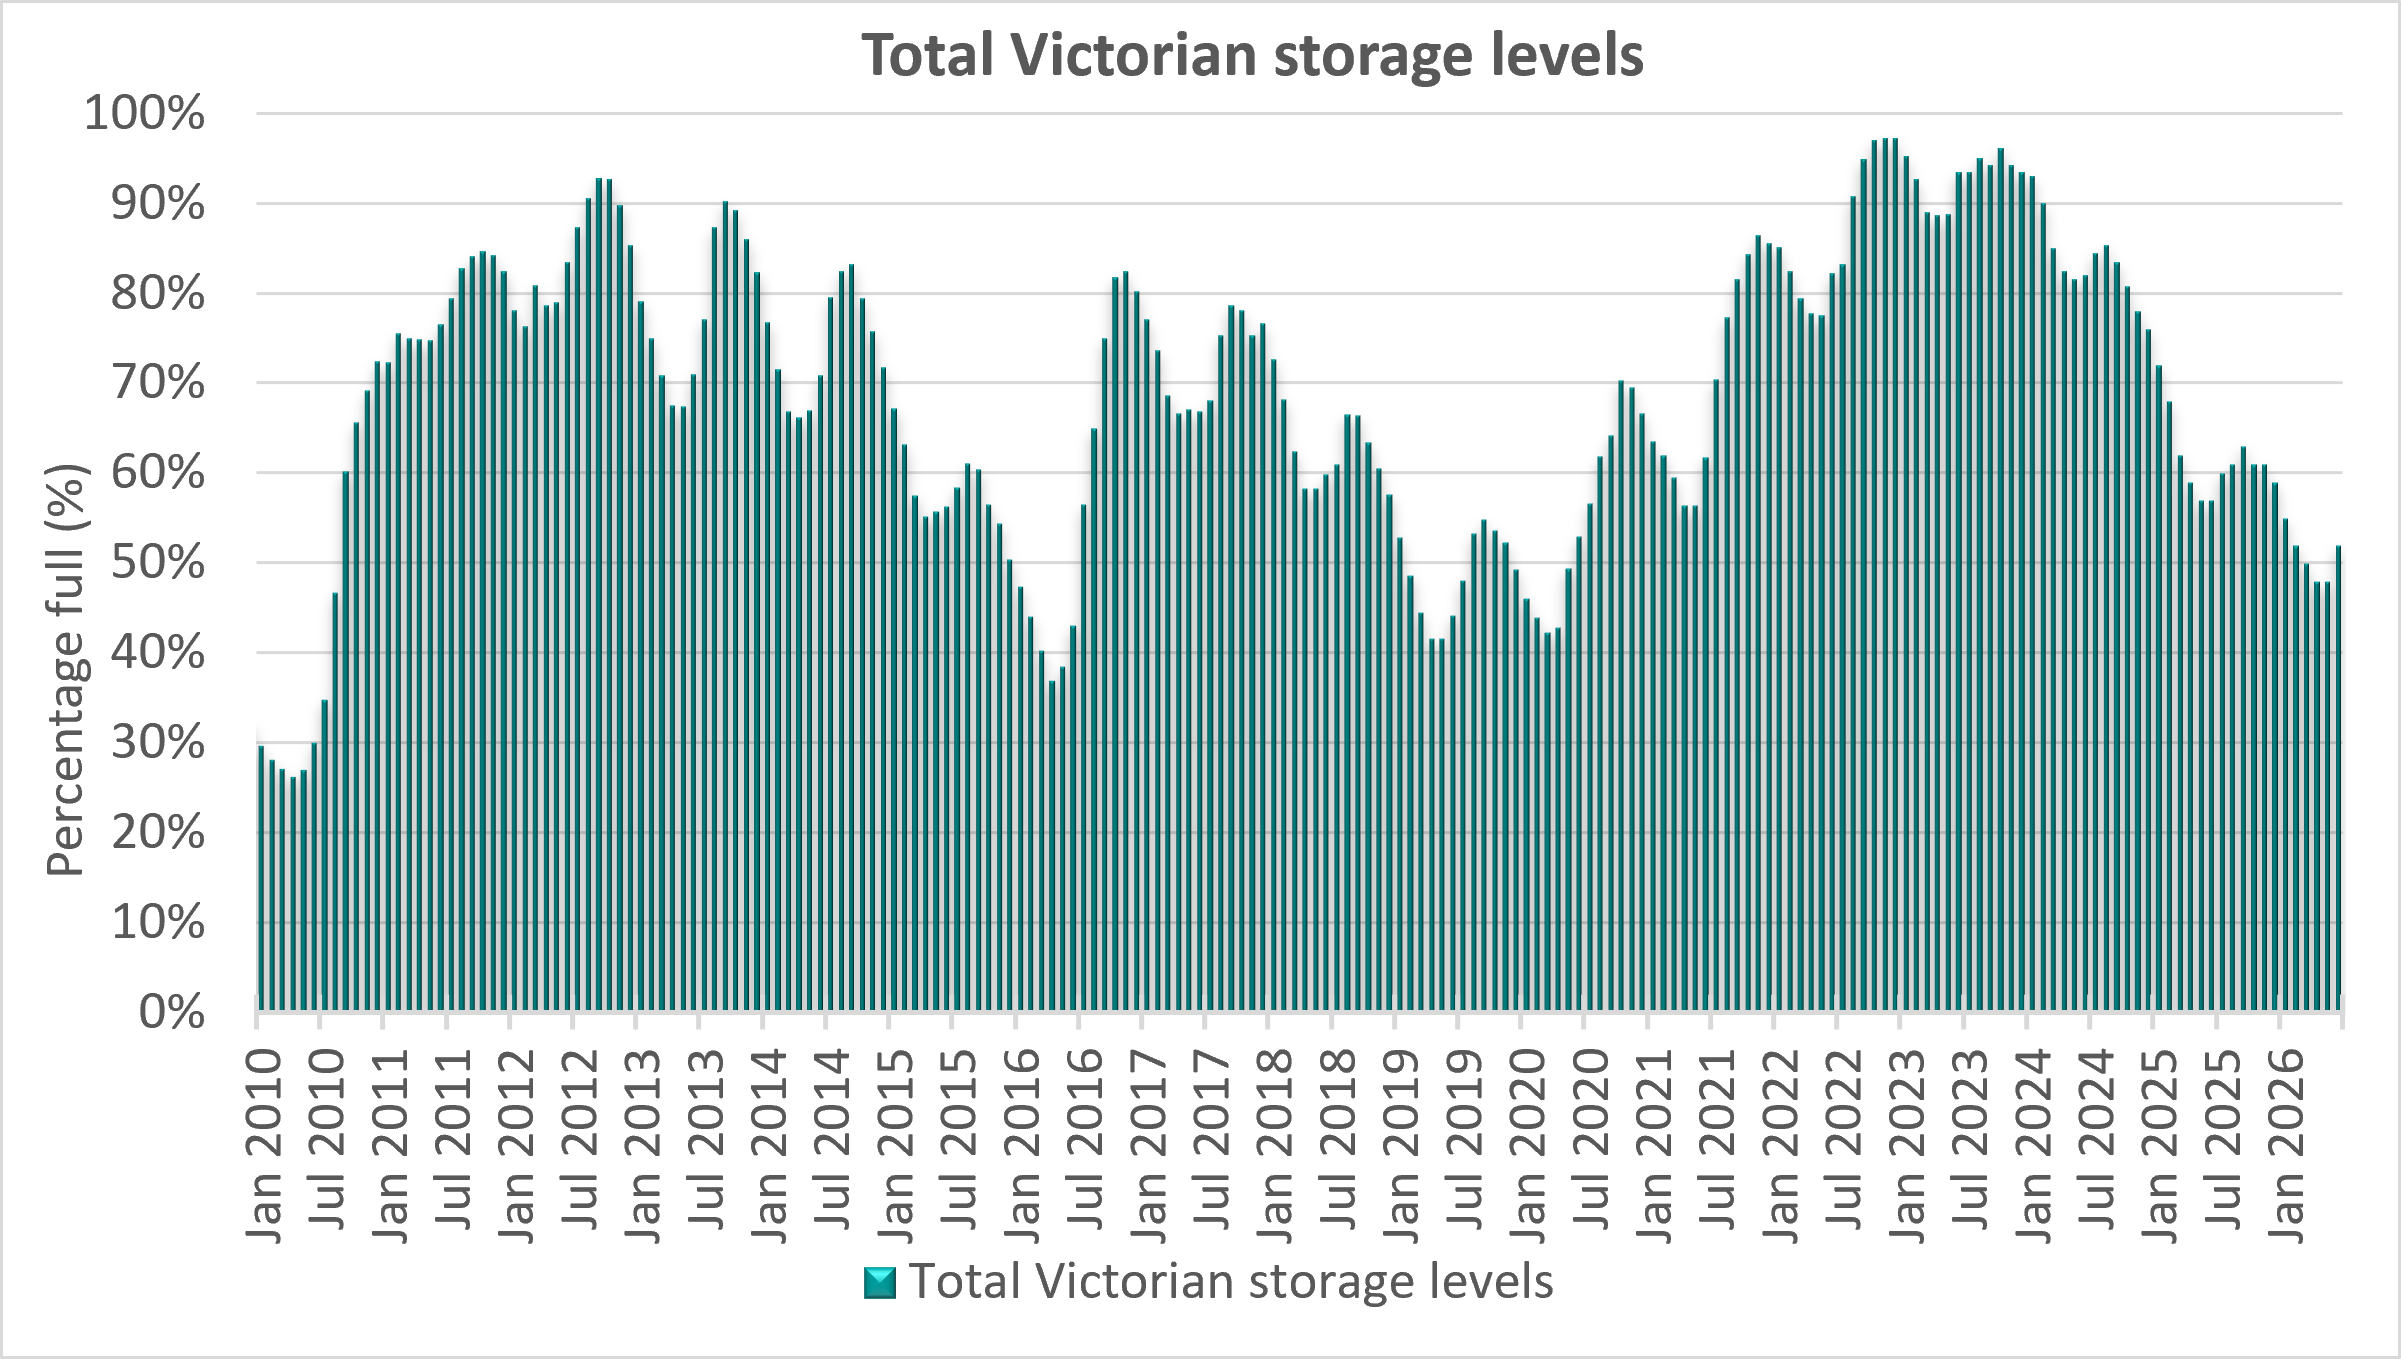
Total Victorian monthly storage levels - end January 2010 to end June 2026
Bureau of Meteorology rainfall maps
On the Bureau of Meteorology websites, view

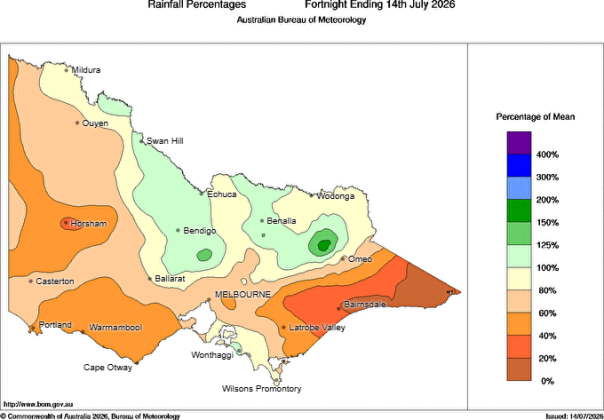
- Map of rainfall received in the week ending 14 July 2026
- Map of rainfall received 1 to 14 July 2026
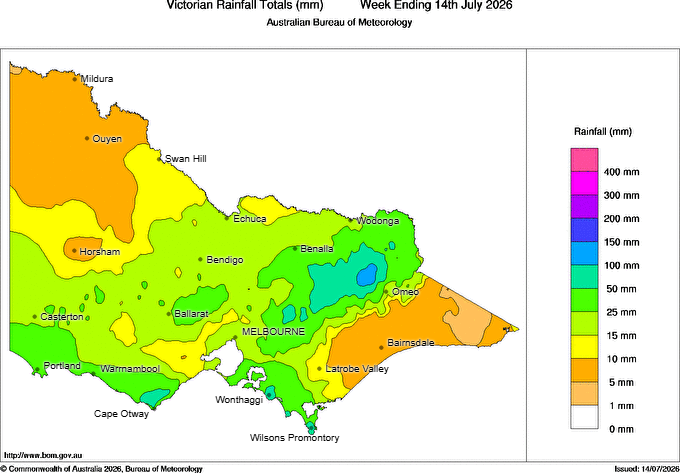
Map of rainfall received in the week ending 14 July 2026

Map of rainfall received 1 to 14 July 2026
Seasonal climate outlook
Bureau of Meteorology climate outlook
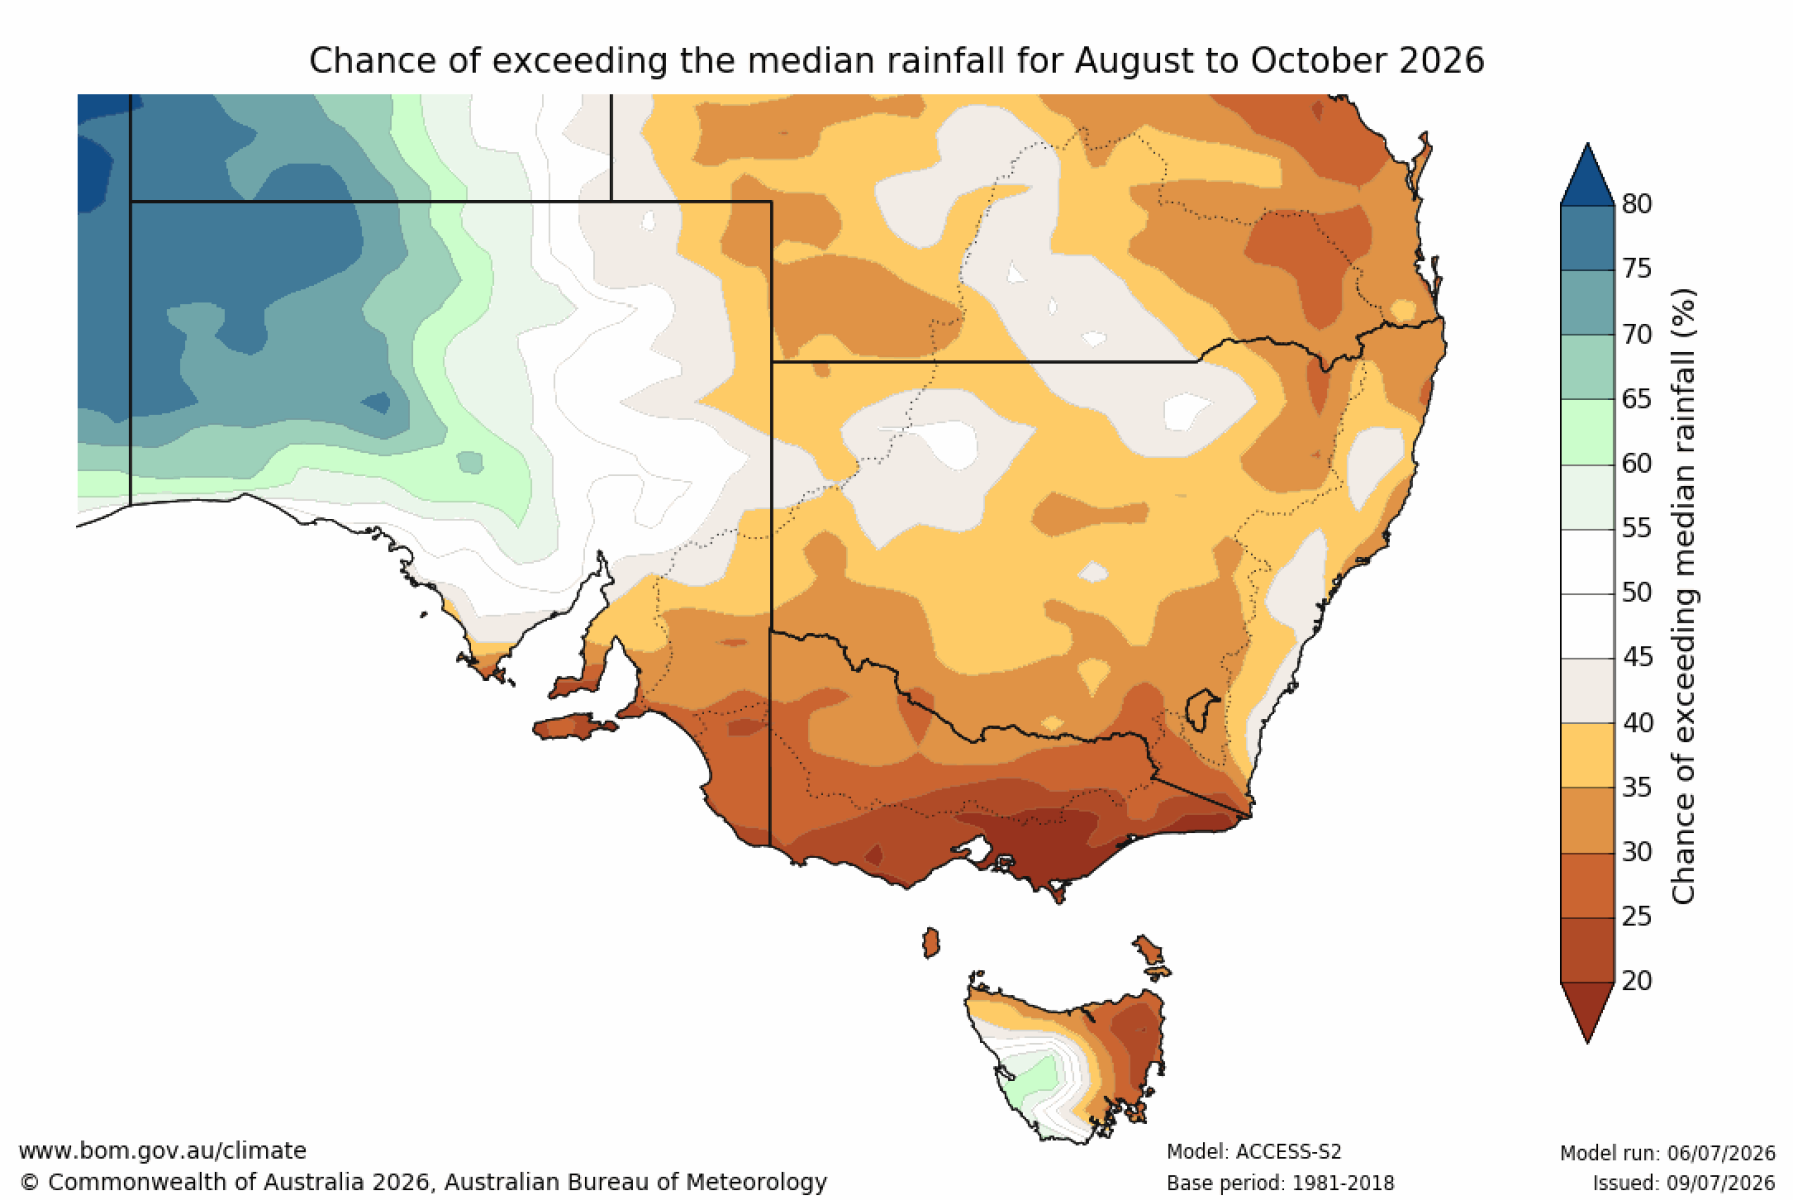
- The Bureau of Meteorology’s outlook predicts a low likelihood (less than 35% chance) of August to October rainfall exceeding the median across Victoria.
- The likelihood of rainfall exceeding the median is highest in the state’s north and north-west (30-35% chance), and lowest across the south-east (less than 20% chance).
- There is a high likelihood (>80% chance) of exceeding the median maximum temperature for August to October across Victoria.
- Updated on 16 July 2026. The next update is expected on 23 July 2026.
Climate driver update
Bureau of Meteorology climate driver update
- El Niño is underway. Sea surface temperatures (SSTs) in the central tropical Pacific are above El Niño thresholds, and atmospheric indicators are also consistent with an El Niño state.
- Forecasts are pointing towards a strong to very strong El Niño event, based on the extent of warming in the central tropical Pacific. However, a strong El Niño signal does not necessarily mean strong impacts on Australia's climate; ENSO is only one of many factors that can influence Australia’s seasonal weather and climate.
- The Indian Ocean Dipole (IOD) is currently neutral. Models suggest a positive IOD event is likely to develop over the southern hemisphere winter and persist into spring.
- The Southern Annular Mode (SAM) index is trending back to neutral after a prolonged positive phase since late May.
- Updated on 14 July 2026. The next update is expected on 28 July 2026.
Current urban restrictions
All towns are currently subject to Permanent Water Saving Rules, except for those in the Forest Hill system (Central Highlands Water), which are on Stage 3 restrictions. This system supplies groundwater to the Allendale, Broomfield, Kingston, Newlyn, Newlyn North, Smeaton and Springmount townships.
More information on urban water corporation restrictions is published on their websites.
Find your urban water corporation.
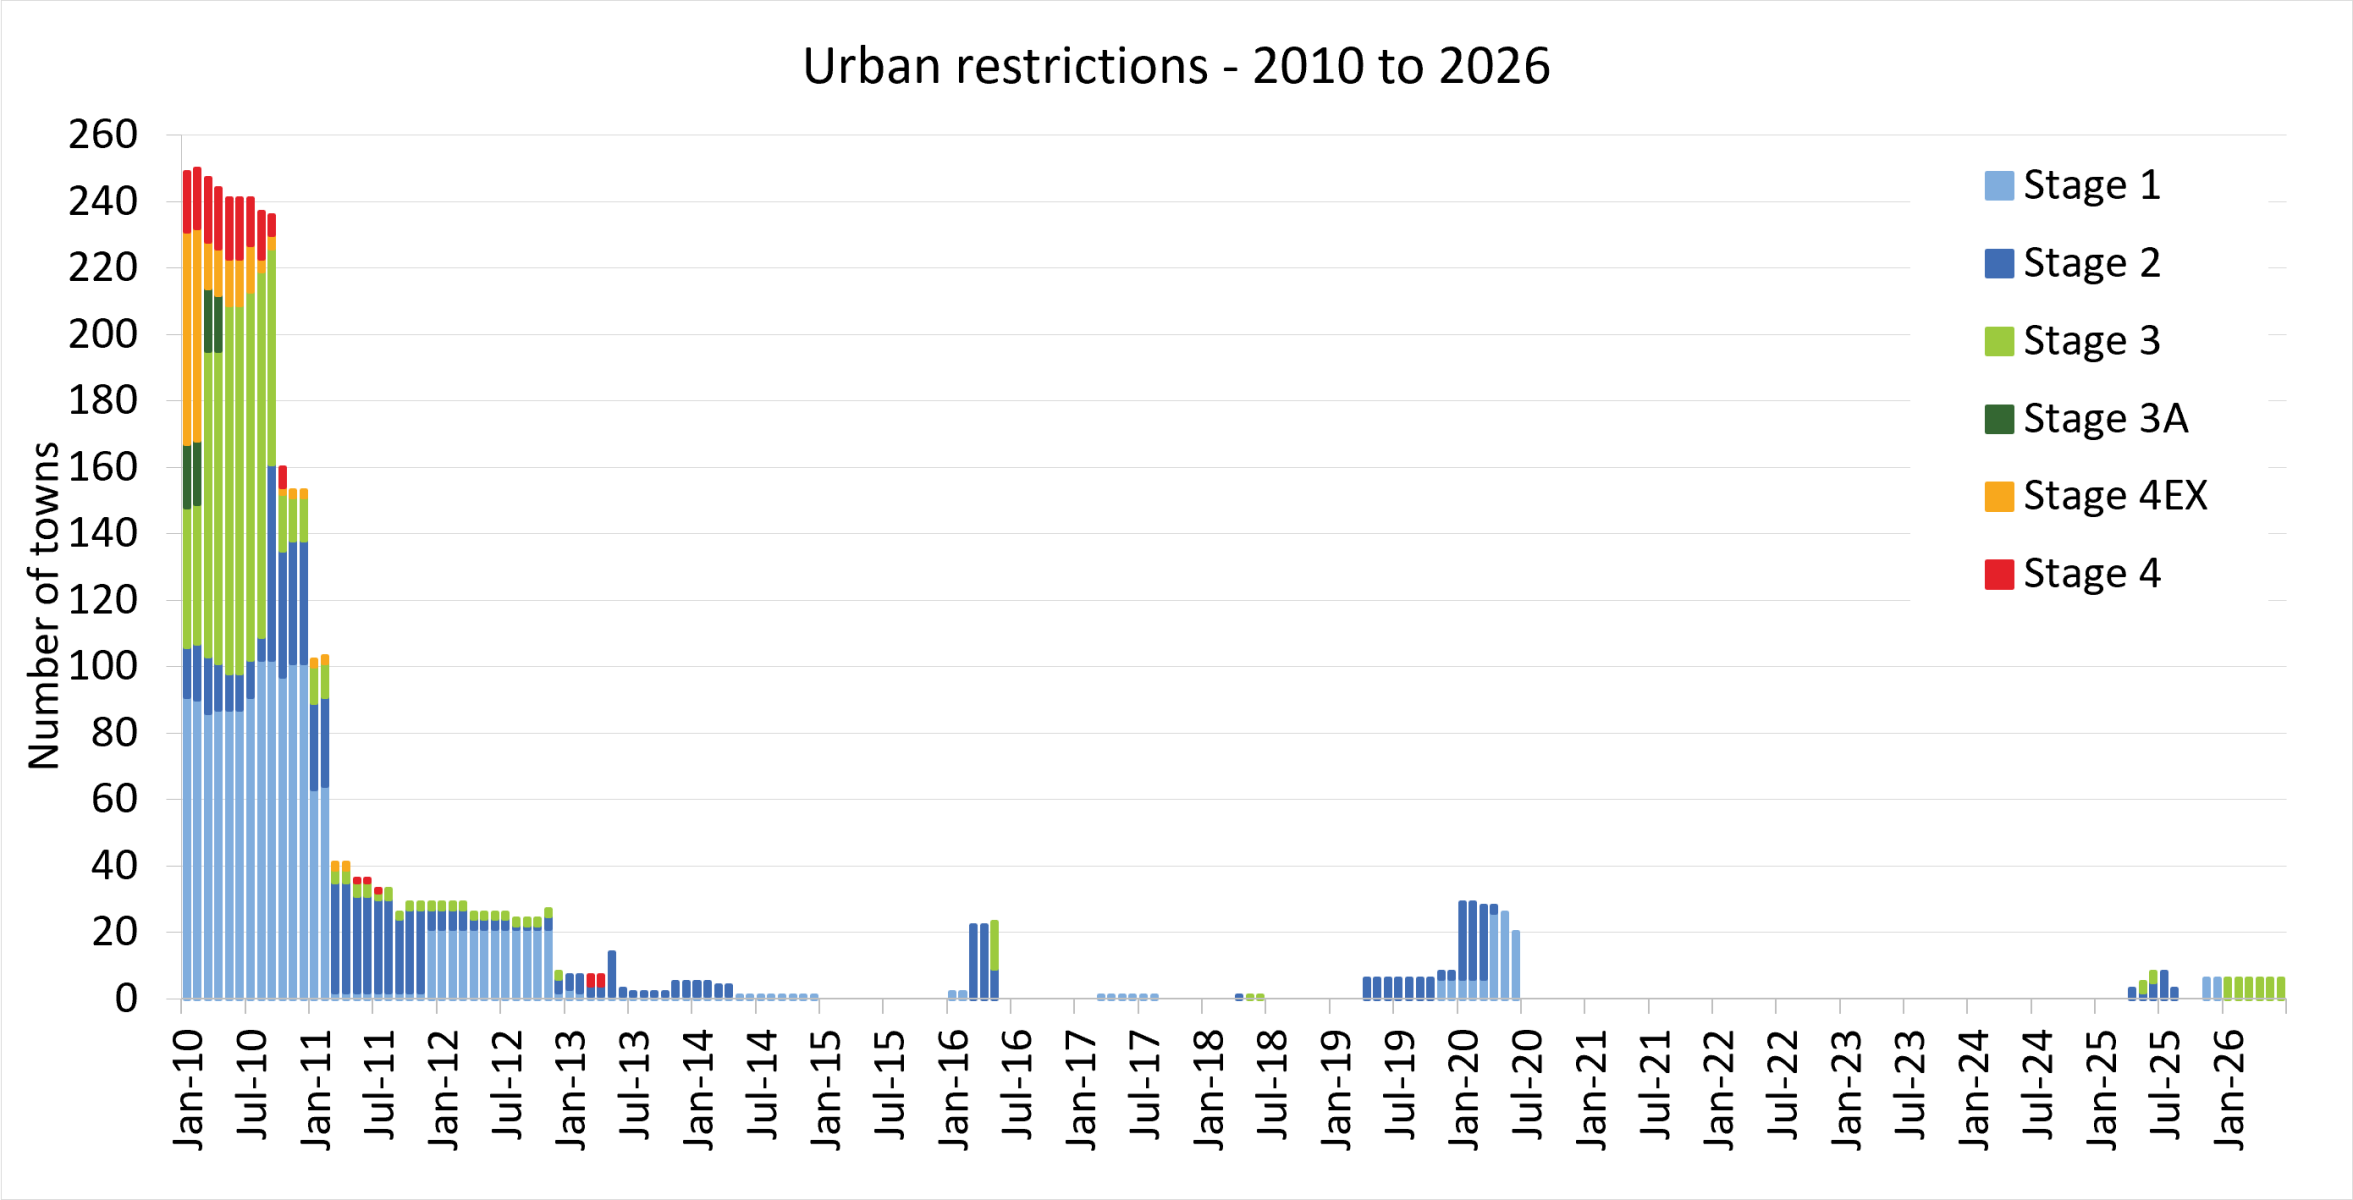
Monthly urban restrictions - 2010 to 2026
The graph and data below are updated at the end of each month.
Updated 2 July 2026. The next update is in early August 2026.
Graph of total number of towns on urban restrictions from January 2010 to June 2026
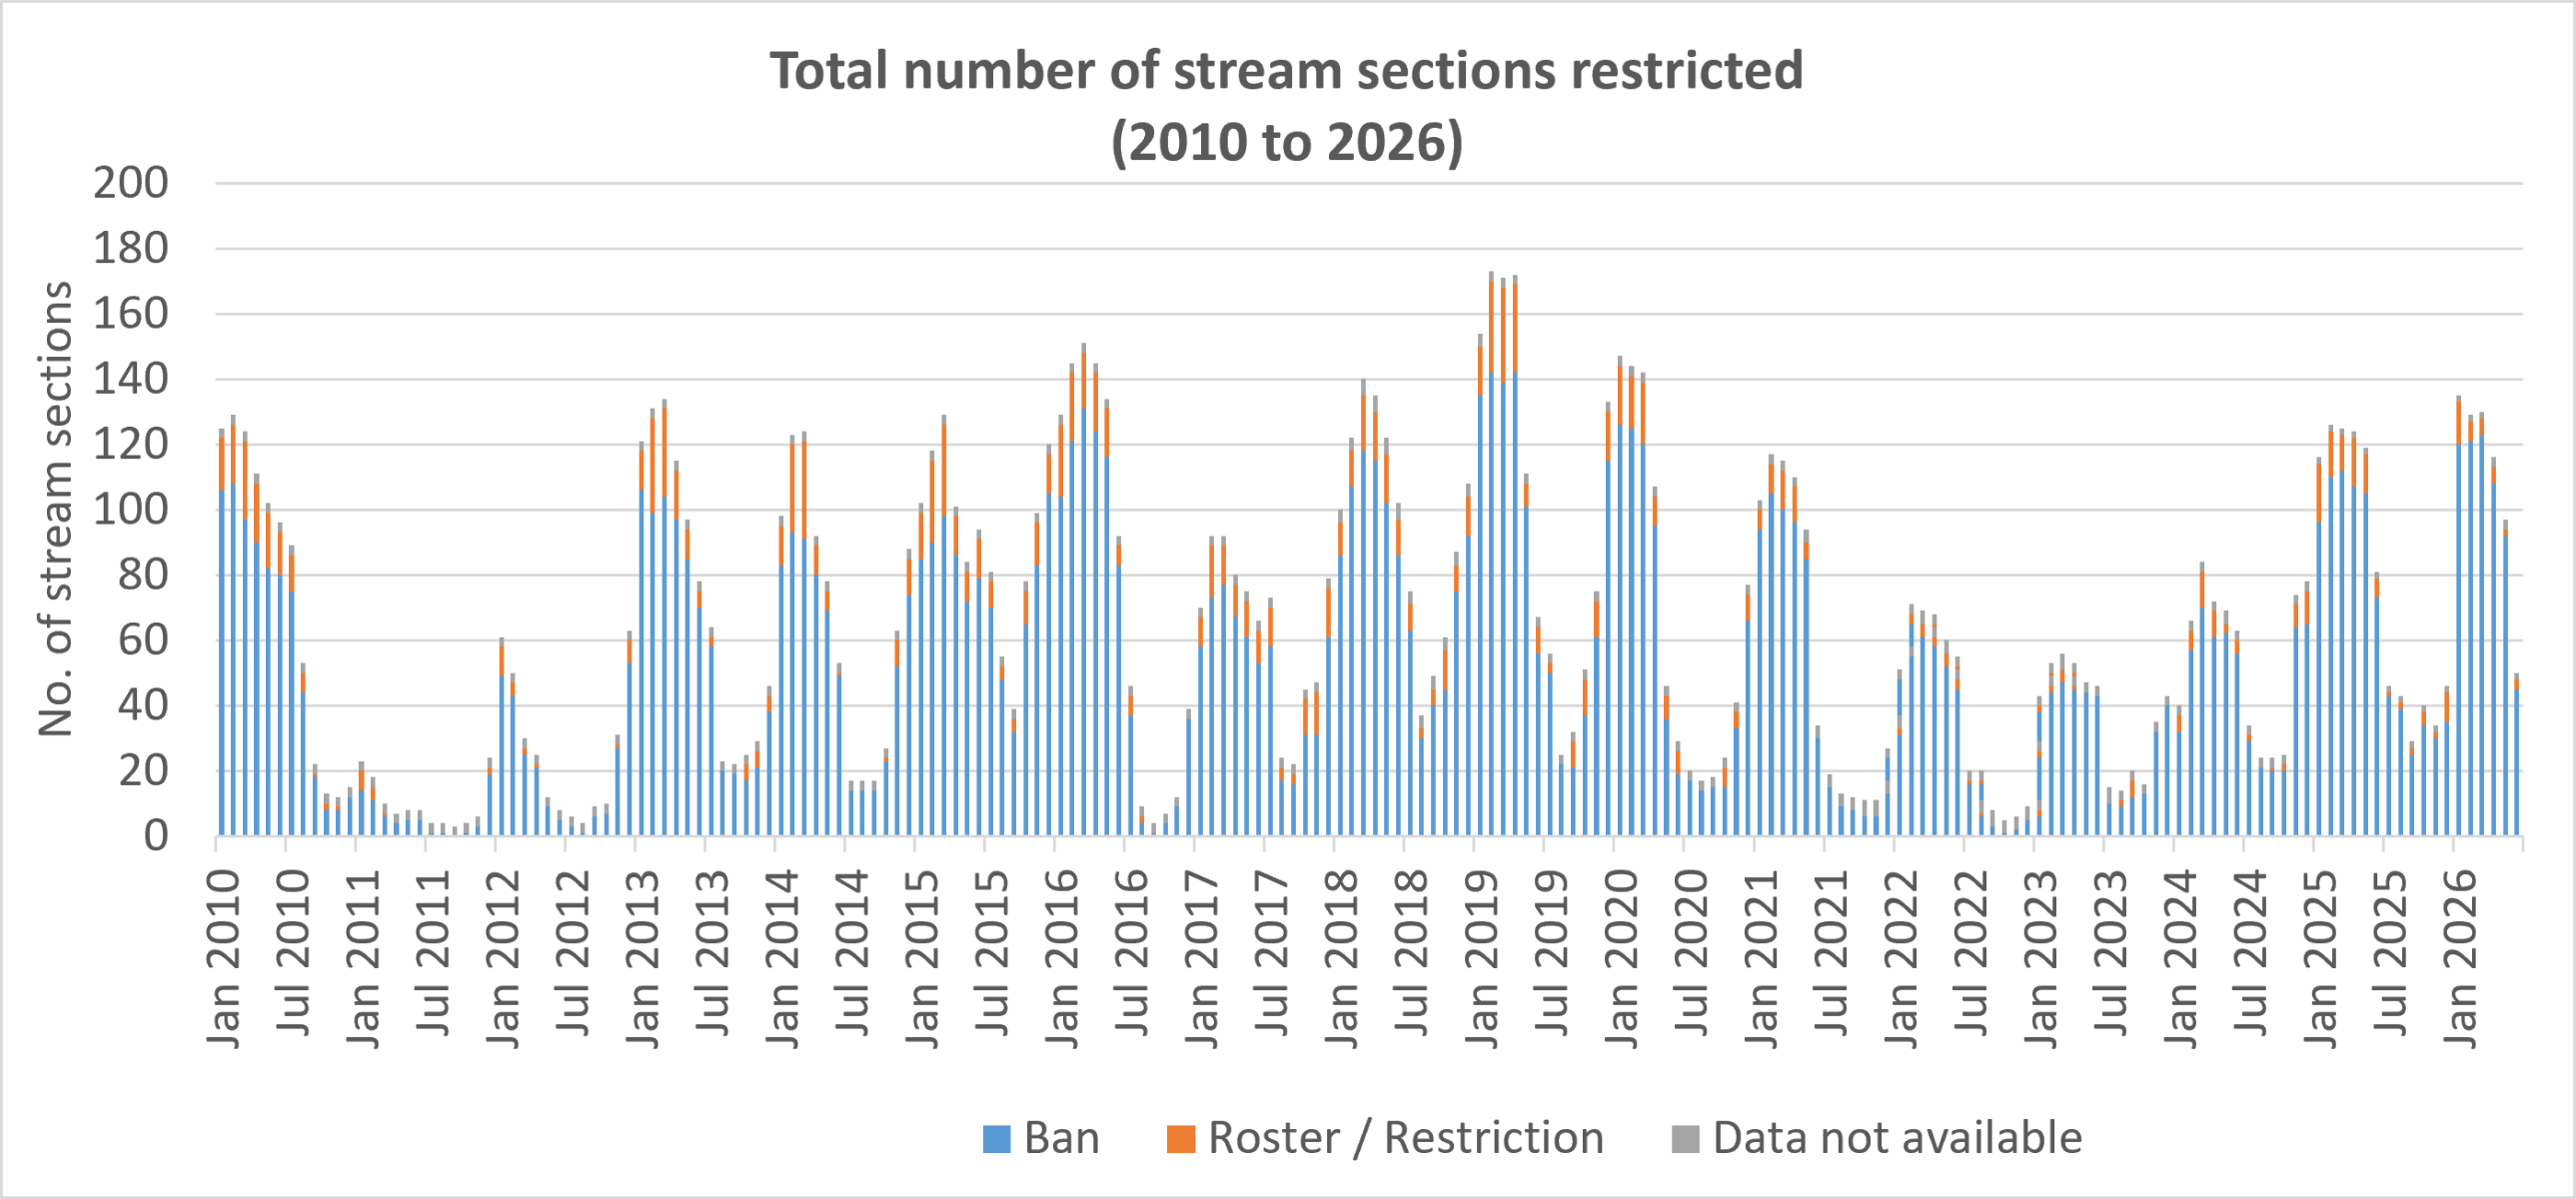
Stream restrictions
End-of-month stream restrictions - 2010 to 2026
As of 30 June 2026, 48 stream sections are subject to diversion restrictions in Victoria (out of a total of 253 stream sections), 31 fewer than the previous year*. These are shown in red and purple in the map below.
Map of streams restricted as at 30 June 2026**
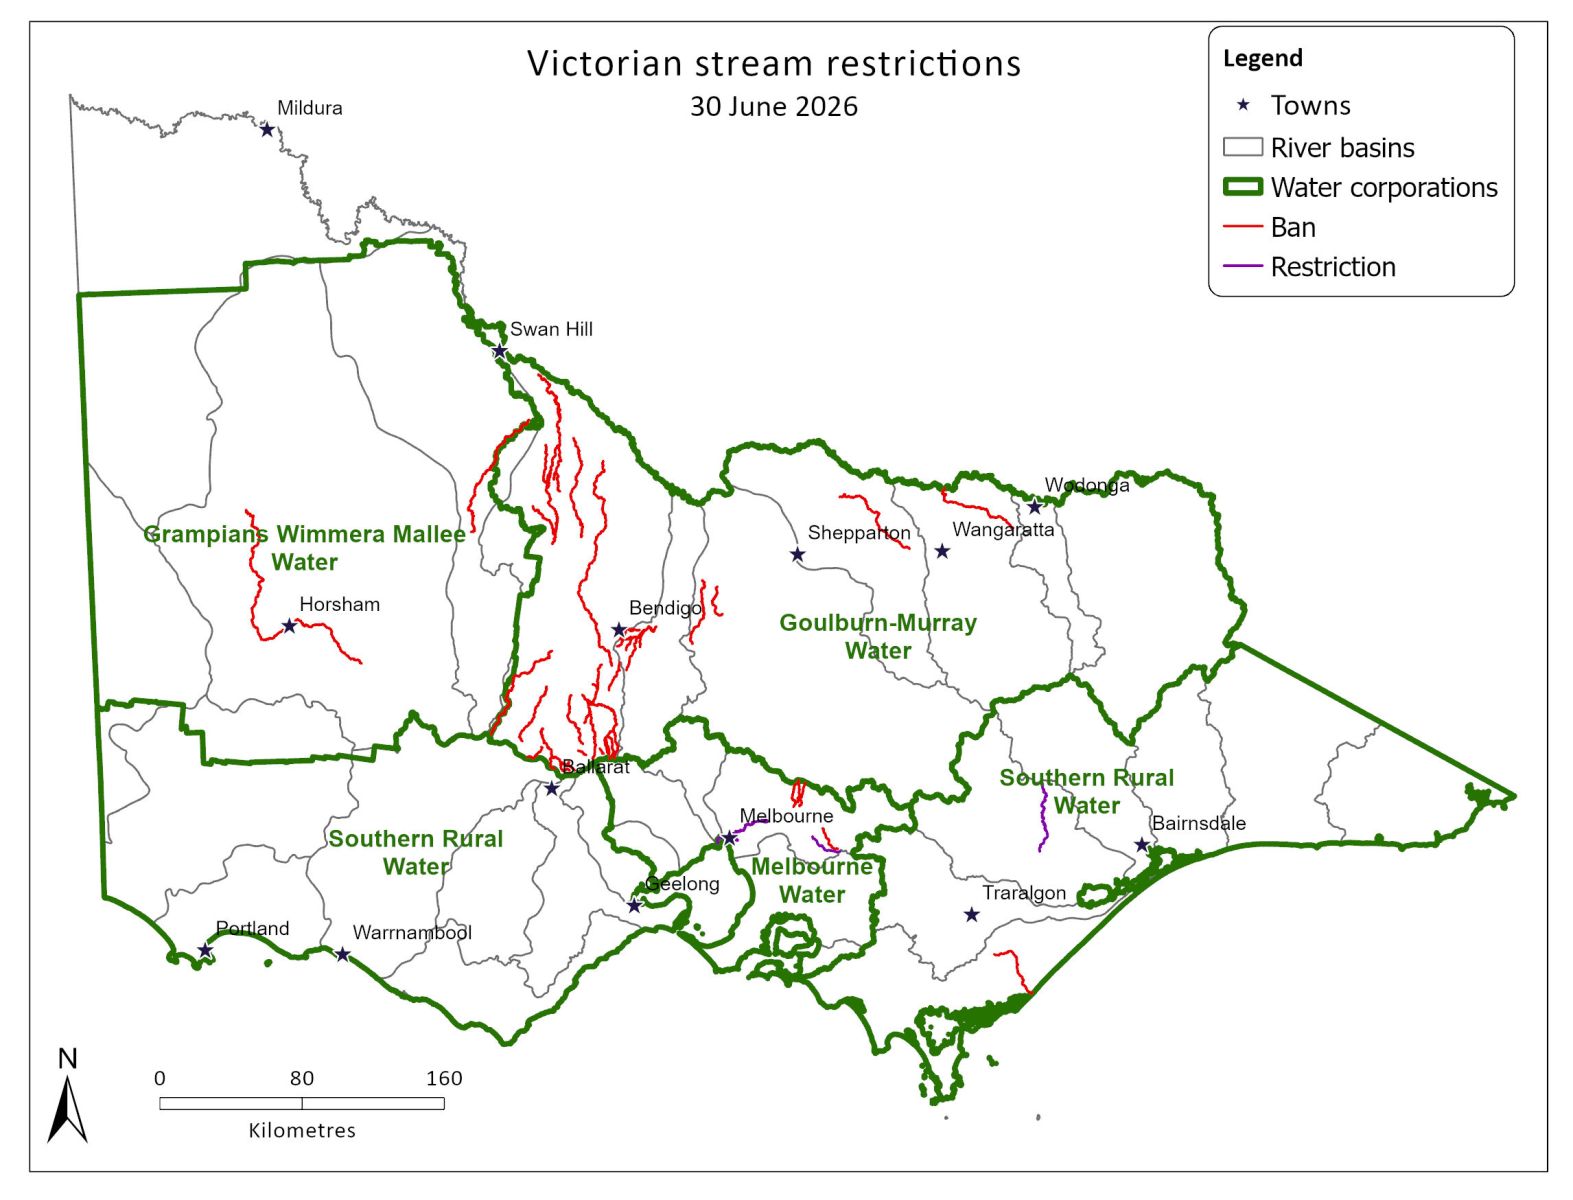
* This count includes management sections subject to diversion restrictions (the term used for partial limitation on take) as well as complete bans on take.
** This map is for indicative purposes only and licence holders should refer to their respective water corporation regarding stream restrictions. This map does not display all stream restrictions.
The graph and data below are as at the end of each month.
Updated 2 July 2026. The next update is late July 2026.
Graph of total number of stream sections restricted from January 2010 to June 2026
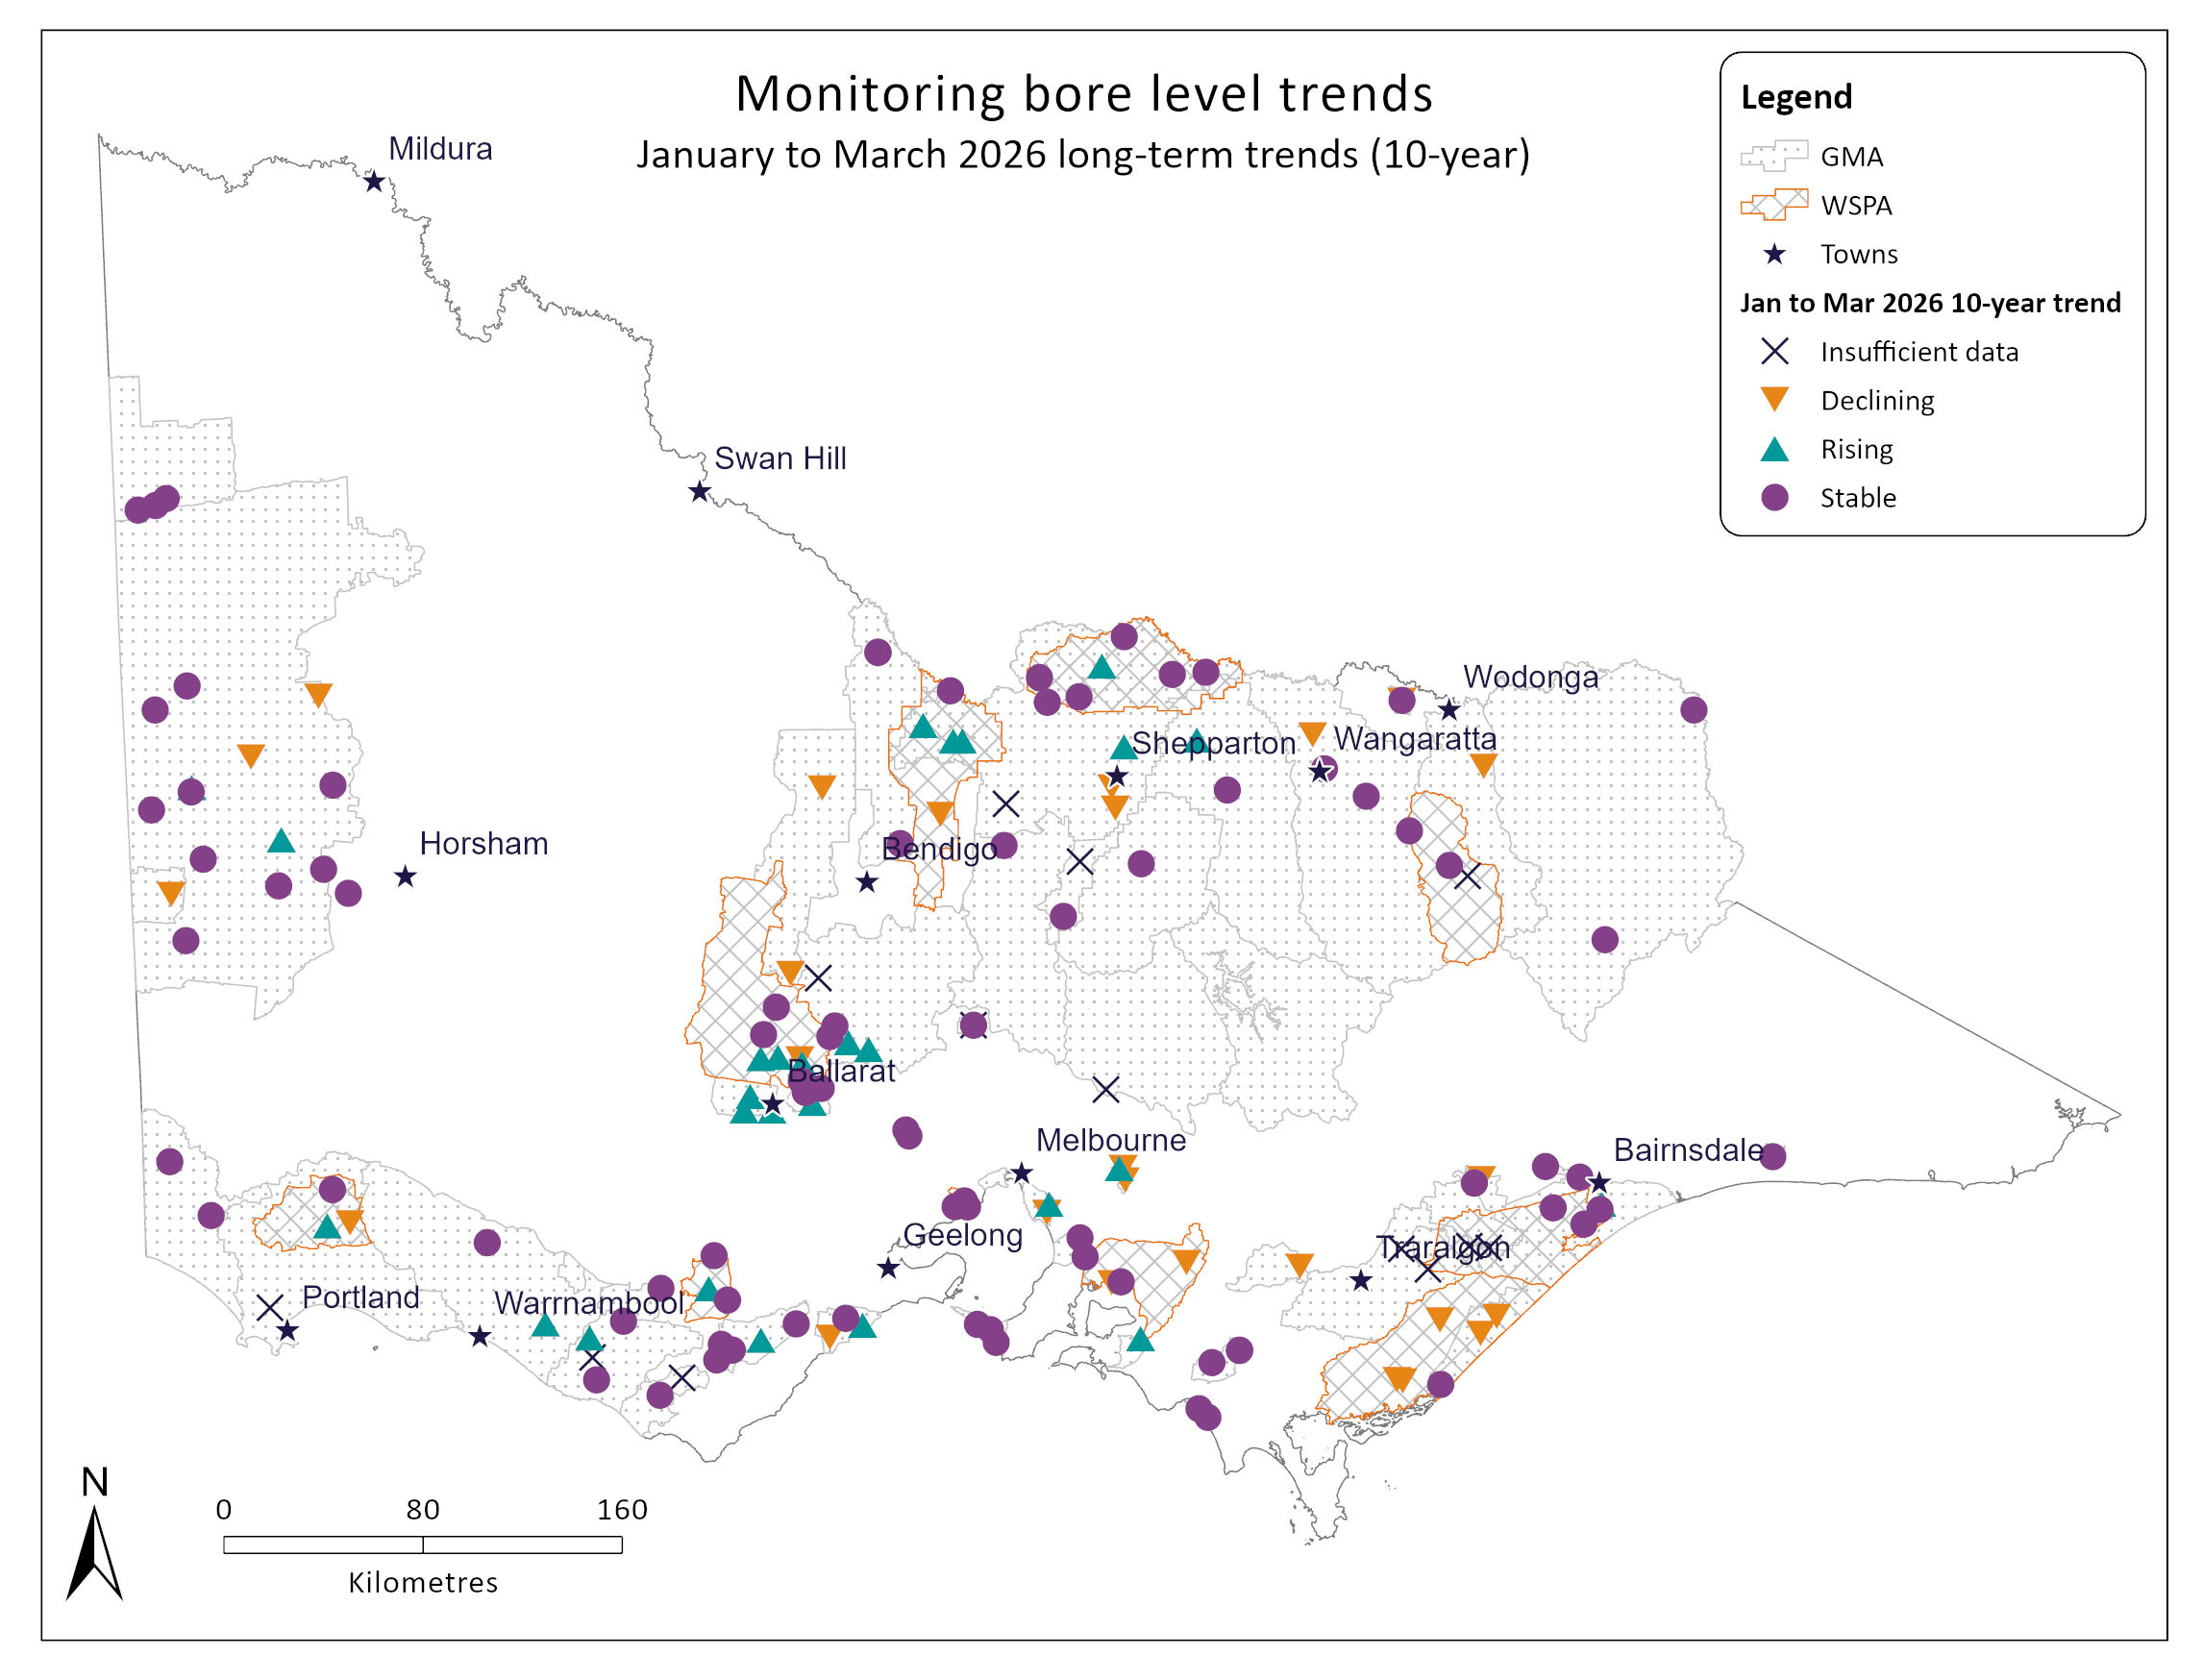
Groundwater summary
Quarterly groundwater level trend update
1 January to 31 March 2026 quarter.
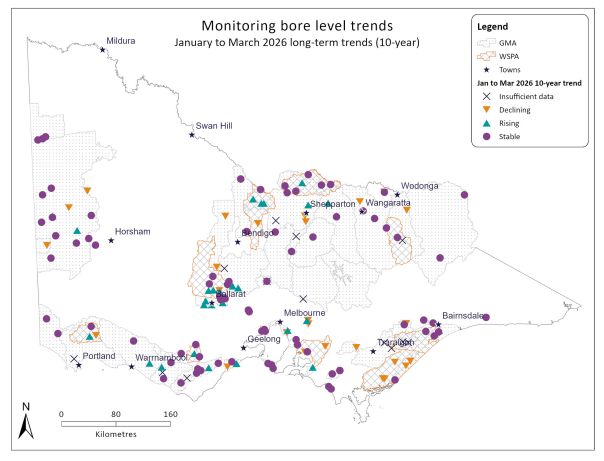
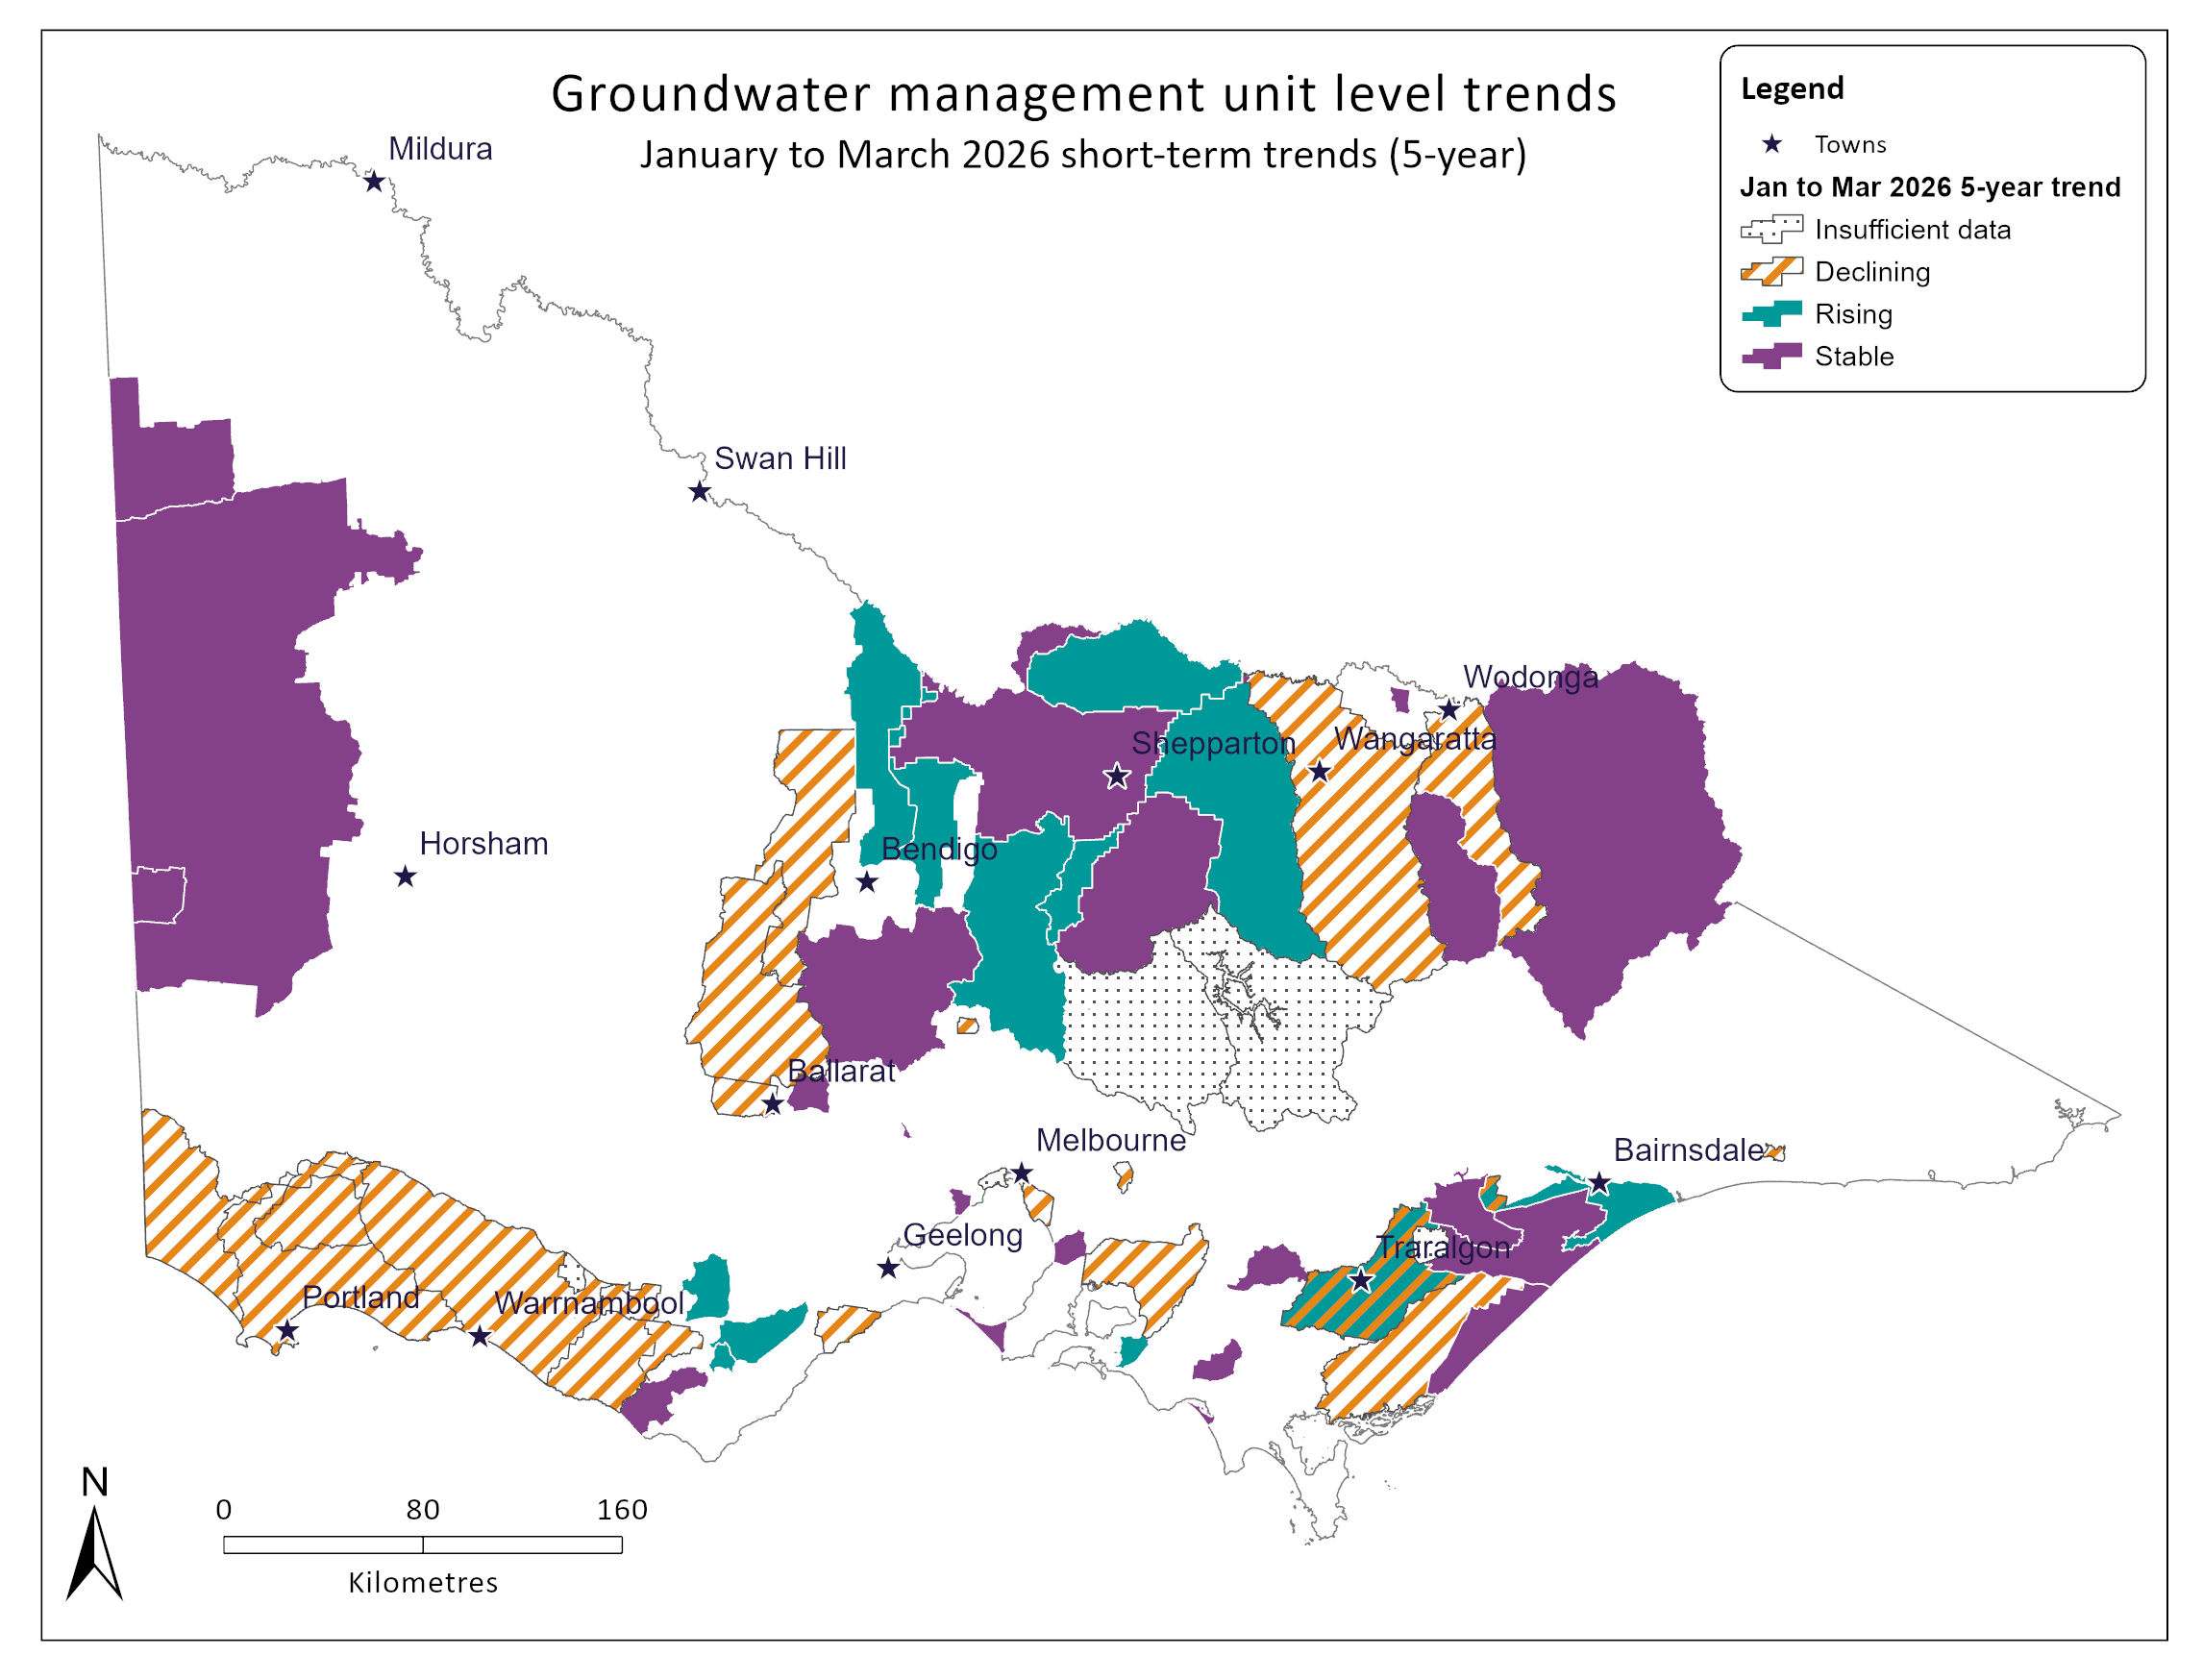
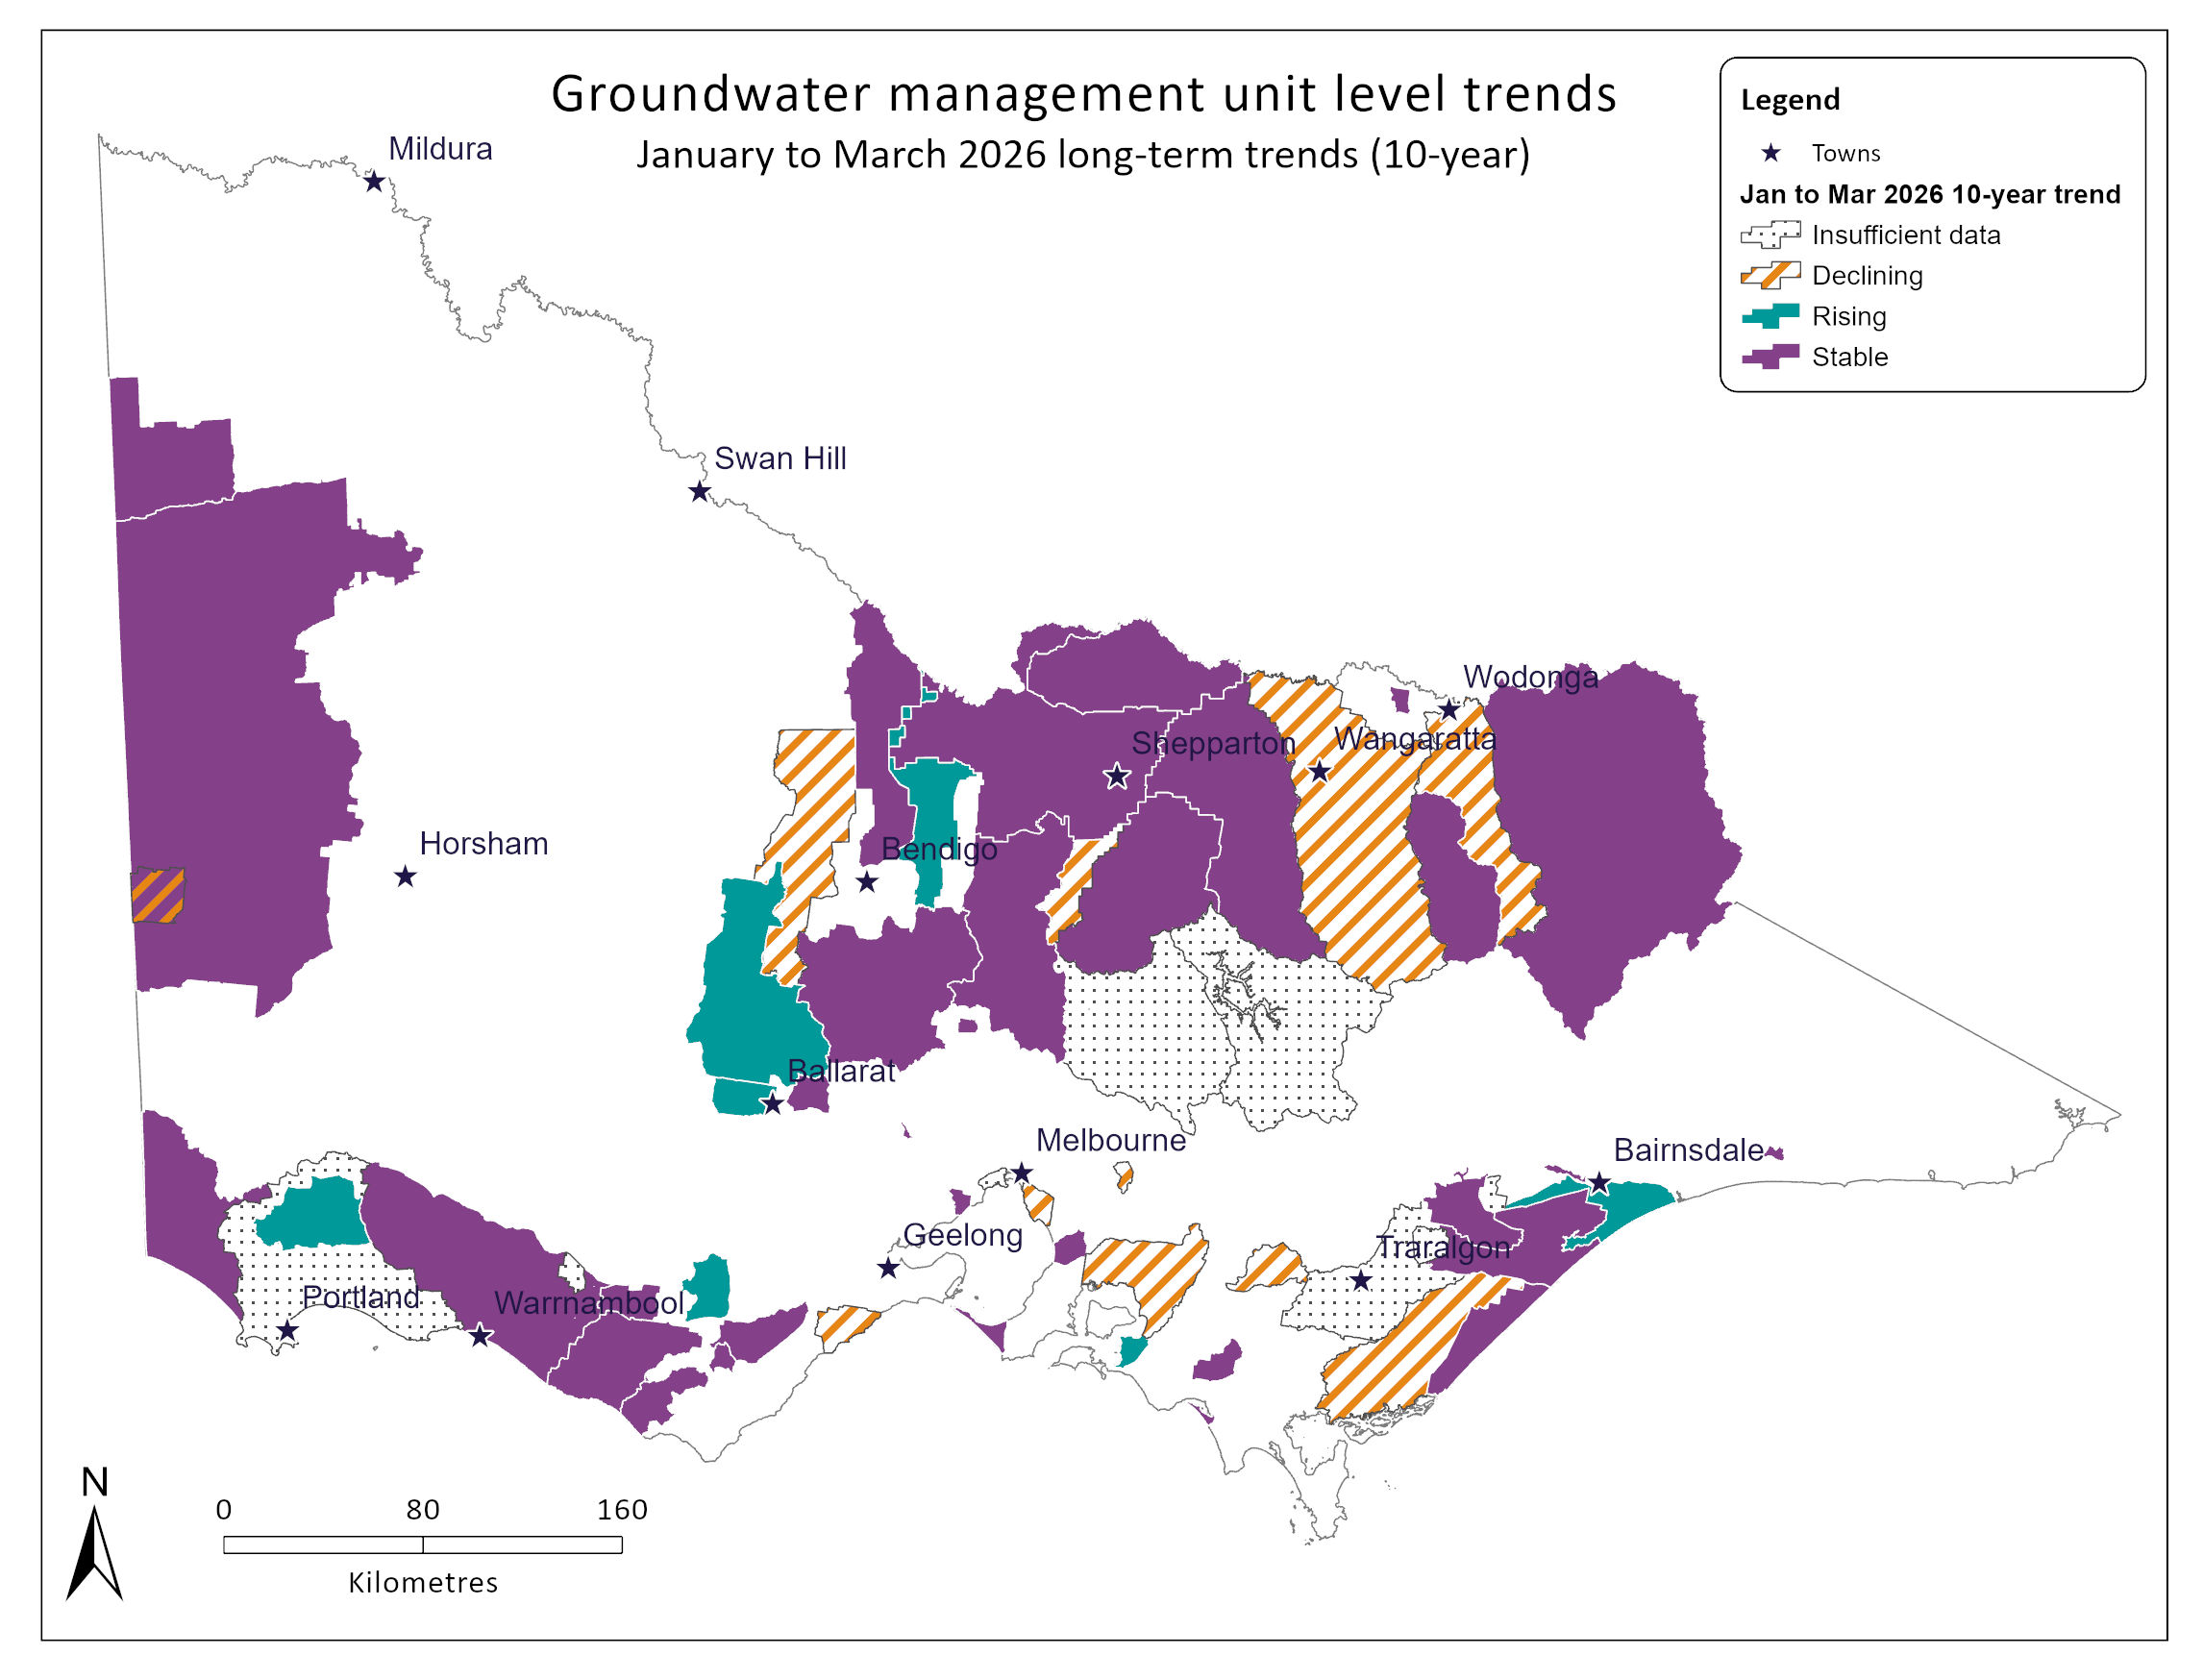
Groundwater level trends in groundwater management units (GMUs) are reported quarterly. Groundwater level trends for GMUs have been determined based on 5 years (short-term) or 10 years (long-term) of consistent monitoring data from key bores in the State Observation Bore Network (SOBN).
There are 2 categories of GMUs:
- Groundwater management areas (GMAs).
- Water supply protection areas (WSPAs).
Updated 28 May 2026. The next update is in August 2026 (for the April to June 2026 quarter).
Notes
- Trends are calculated mathematically using data with variable timescales, and do not necessarily represent the status of the resource for management purposes.
- There was insufficient data or monitoring bores available to determine a short-term trend in 5 GMAs, and long-term trend in 7 GMAs.
Short and long term groundwater level trend maps
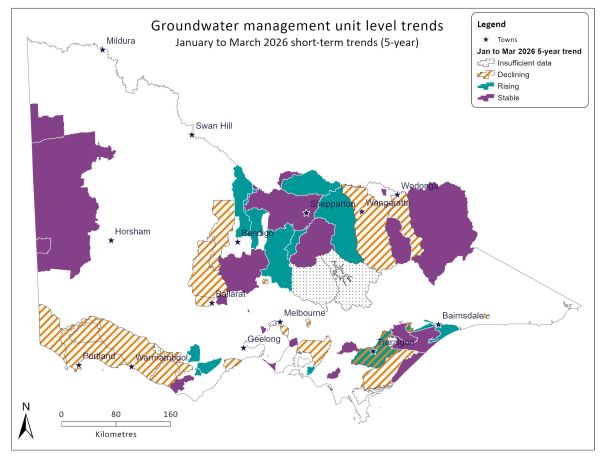
- Groundwater management unit short-term trends - January to March 2026 quarter
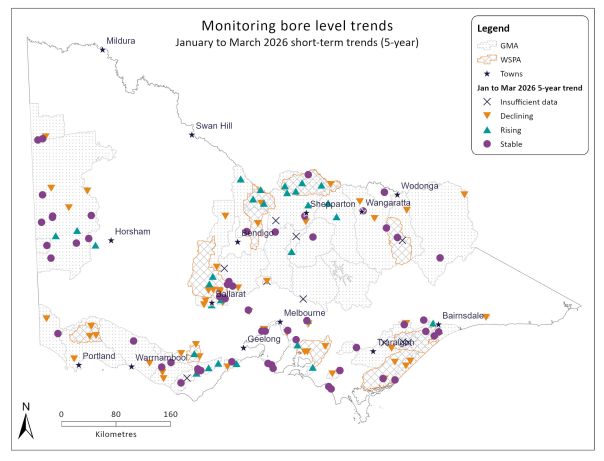
- State Observation Bore Network key bore short-term trends - January to March 2026 quarter
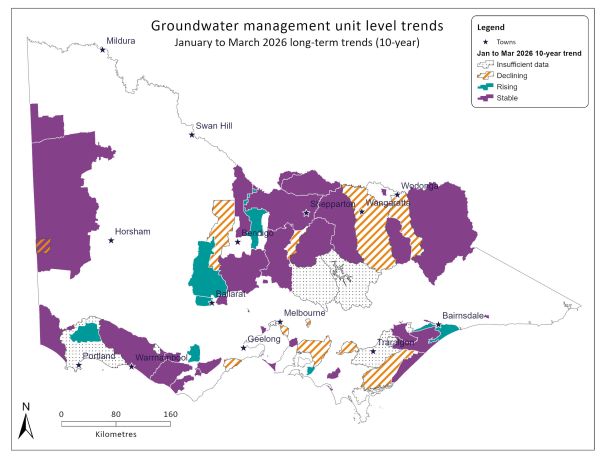
- Groundwater management unit long-term trends - January to March 2026 quarter
- State Observation Bore Network key bore long-term trends - January to March 2026 quarter
Groundwater management unit short-term trends - January to March 2026 quarter
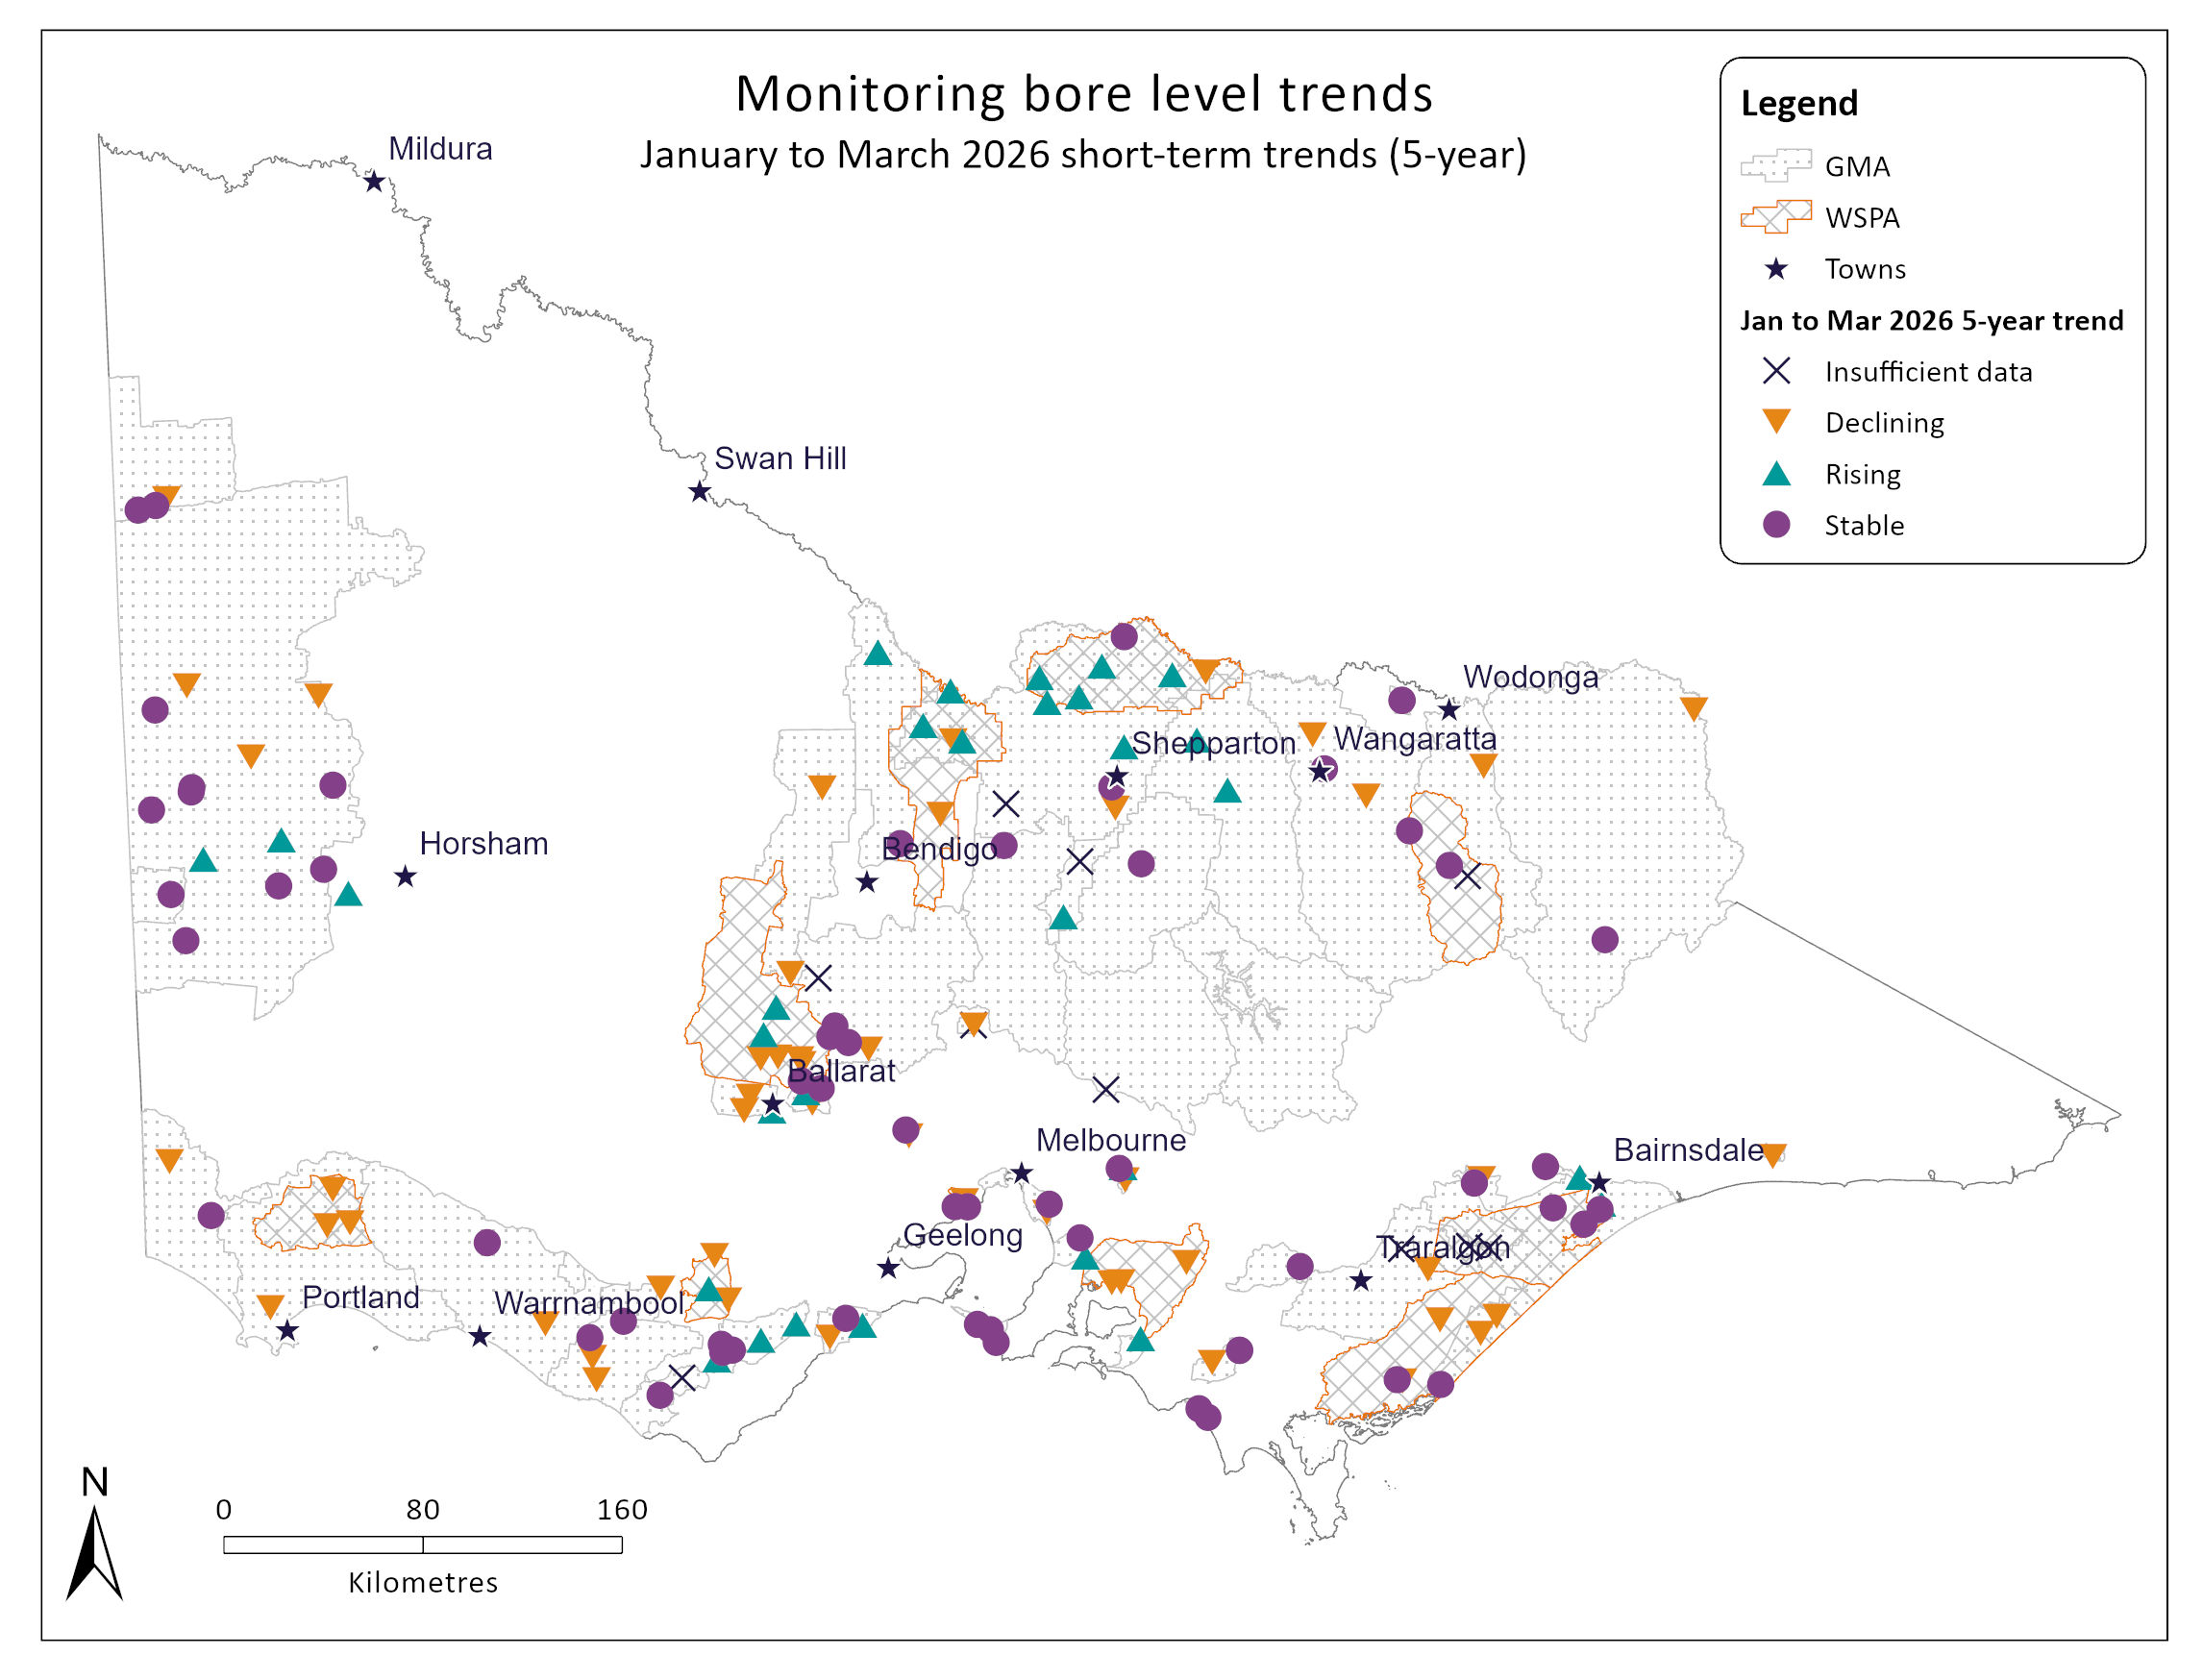
State Observation Bore Network key bore short-term trends - January to March 2026 quarter
Groundwater management unit long-term trends - January to March 2026 quarter
State Observation Bore Network key bore long-term trends - January to March 2026 quarter
Groundwater restrictions
In 2026-27, 3 GMUs are subject to allocation restrictions:
- Barnadown zone (Lower Campaspe Valley WSPA) at 75%.
- Deutgam WSPA at 25%.
- Neuarpur subzone 1 (West Wimmera GMA) at 80%.
Updated 16 July 2026.
Seasonal determinations and allocations
Seasonal determinations are made against water shares to provide allocations in declared systems. These can be for high reliability (HRWS) or low reliability (LRWS) water shares. In northern Victoria, Goulburn-Murray Water makes the seasonal determinations in the relevant systems, while Southern Rural Water makes the seasonal determinations in the Thomson/Macalister and Bacchus Marsh/Werribee systems.
In the Grampians Wimmera Mallee Water area, resource assessments are undertaken every month to determine the amount of water that can be made available to entitlement holders. These monthly assessments result in a formal announcement on water allocations.
Coliban Water assesses seasonal allocations for customers on its rural network based on available resources in the Coliban System.
Goulburn-Murray Water
| System | Seasonal determinations HRWS | Seasonal determinations LRWS | Date updated |
|---|---|---|---|
| Murray | 36% | 0% | 15 July 2026 |
| Broken | 12% | 0% | 15 July 2026 |
| Goulburn | 30% | 0% | 15 July 2026 |
| Campaspe | 100% | 0% | 15 July 2026 |
| Loddon | 30% | 0% | 15 July 2026 |
| Bullarook | 27% | 0% | 15 July 2026 |
Southern Rural Water
| System | Seasonal determinations HRWS | Seasonal determinations LRWS | Date updated |
|---|---|---|---|
Bacchus Marsh / Werribee | 45% | 0% | 14 July 2026 |
| Thomson / Macalister | 95% | 0% | 14 July 2026 |
Grampians Wimmera Mallee Water
| System | 2026-27 Seasonal determinations | Date updated |
|---|---|---|
| Wimmera-Mallee Pipeline Product | 12% | 1 July 2026 |
Coliban Water
| System | Seasonal determinations | Date updated |
|---|---|---|
| Coliban Rural System | 60% | 1 July 2026 |
Page last updated: 16/07/26