More than a quarter of Victorian Government emissions are from the water sector.
The Victorian water sector is a major source of greenhouse gas emissions. 30% of the Victorian Government’s emissions come from wastewater, largely from Melbourne Water’s Eastern and Western Treatment plants.
Direct and indirect emissions
There are 3 distinct categories of emissions, which are produced via different water sector activities. For more information on the types of emissions, open the drop down boxes below or visit: Emissions and energy types.
Emissions and energy types
These are greenhouse gases that are released into the atmosphere as a direct result of the organisation’s actions.
Most of the water sector’s direct emissions come from treating sewage and wastewater. The bacteria that break down organic material and remove excess nutrients produce greenhouse gases while they work.
These gases can be released into the atmosphere at several stages during the wastewater treatment process, as pictured in the diagram below.
Transport fuels used by the water sector’s vehicles are the second largest source of direct emissions. These emissions can be reduced by switching to renewable fuels and zero emissions vehicles.
This infographic is generic and aims to demonstrate where methane (CH4 in blue) and nitrous oxide (N2O in red) emissions can typically arise during wastewater treatment. It does not represent the different scale of emissions during different stages of treatment. This is because the amount of emissions at each stage is dependent on many factors and the individual setup of a wastewater treatment plant. While carbon dioxide is produced in multiple stages of the wastewater treatment process, it often does not result in a net increase in atmospheric carbon dioxide and as such has been excluded from this graphic.
These are greenhouse gases released into the atmosphere from indirect consumption of energy.
Electricity is needed to treat wastewater and to move water around Victoria. In the past, most of this electricity was generated by burning fossil fuels.
Today, water sector operations are now completely powered by renewable electricity, including solar, wind and hydroelectricity. More information on how the water sector made this transition is detailed in the Water Sector Emissions Transition Plan here.
These are the greenhouse gases released into the atmosphere produced by activities upstream or downstream of an organisation. They usually sit outside an organisation’s direct control.
For the water sector, these include emissions from the supply chain – for example, construction materials, chemicals and contractor services – as well as the transport of goods and materials used by the water sector.
In 2025 the water sector became completely powered by renewable electricity, reducing scope 2 emissions to zero. However, reducing emissions from wastewater remains a big challenge.
The Victorian water sector produces 3 main greenhouse gases from its direct and indirect activities. These gases are mostly made up of methane, nitrous oxide and carbon dioxide.
Types of greenhouse gases released by the Victorian water sector
Methane is a potent greenhouse gas that is produced from decomposing organic material, fossil fuels and landfills. It traps more heat than carbon dioxide, but it does not remain in the atmosphere for as long.
In the water sector, methane is released during wastewater treatment when bacteria break down organic matter without oxygen. Because the sector treats large volumes of wastewater, methane is the main greenhouse gas it releases.
Nitrous oxide is a potent greenhouse gas that is produced from agriculture, industrial processing and fossil fuels. It can trap more heat than methane and carbon dioxide and remains in the atmosphere for long periods of time.
In the water sector, nitrous oxide can be produced during wastewater treatment when bacteria remove nitrogen from wastewater.
Carbon dioxide is a greenhouse gas produced primarily by burning fossil fuels.
In the water sector, the biggest source of carbon dioxide is transport. Trucks and cars that move waste and staff around release carbon dioxide into the atmosphere.
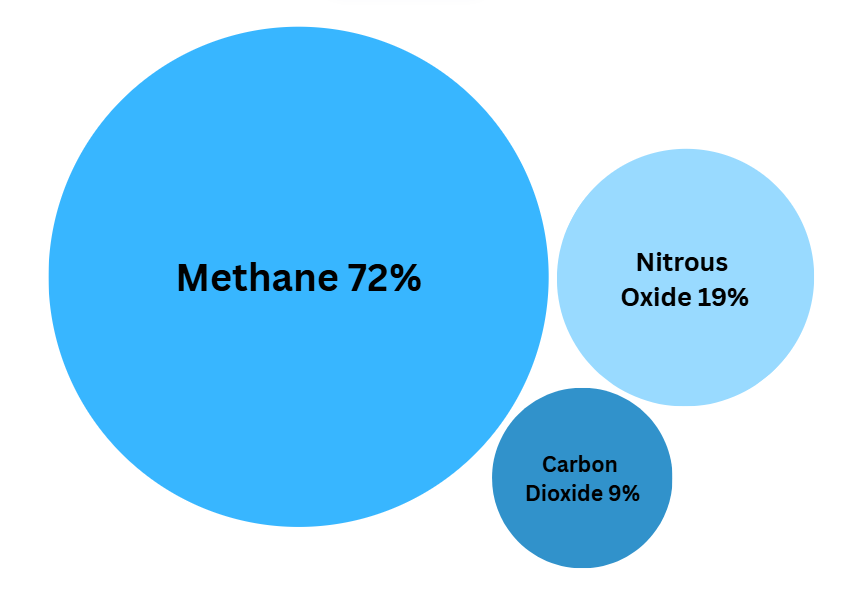
Following the switch to renewable electricity, more than 90% of the water sector’s operational emissions are methane and nitrous oxide.
These strong greenhouse gases are released from the processes that treat wastewater for either re-use or safe release into the environment. Carbon dioxide makes up 9% of the water sectors emissions.
Disclaimer: The percentage of carbon dioxide includes a very small proportion of other greenhouse gases. These figures are derived from 2024-25 financial year data.
Methane makes up 72% of the water sectors greenhouse gas emissions, nitrous oxide makes up 19% and carbon dioxide makes up 9%. These figures are derived from 2024-25 financial year data.
Disclaimer: The percentage of carbon dioxide includes a very small proportion of other greenhouse gases. These figures are derived from 2024-25 financial year data.
Methane and nitrous oxide can be difficult to measure, which is why the Water Sector Emissions Transition Plan is helping water corporations find ways to understand this better.
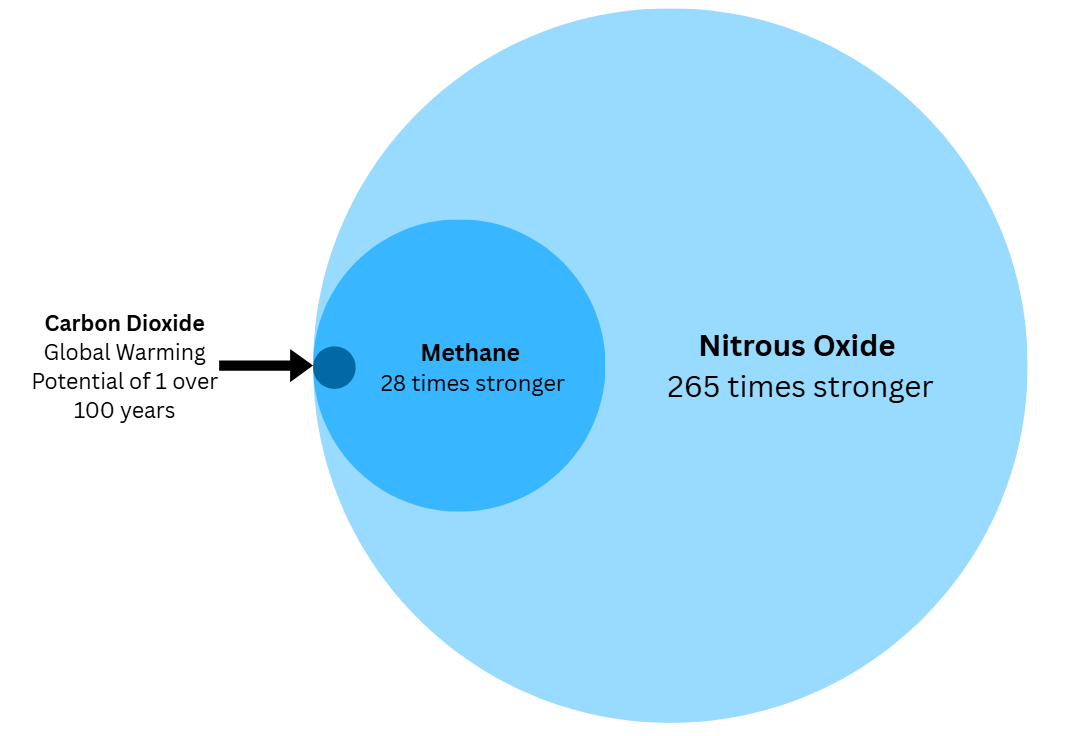
The Global Warming Potential is a metric used to compare the ability of different greenhouse gases to trap heat in the atmosphere over a 100 year period, as depicted in the graphic below.
It can be a useful way to understand how much each gas contributes towards the warming of our planet.
Disclaimer: This graphic is not to scale and does not represent the size of the different greenhouse gases. It represents a visual comparison of the ability of each gas to trap heat in the atmosphere.
Global Warming Potential is a metric used to compare how much heat is trapped in the atmosphere by certain greenhouse gases over a 100 year period.
Carbon dioxide is used as a benchmark to understand the heat-trapping ability of other gases like methane and nitrous oxide.
Methane is estimated to be 28 times stronger than CO2 over 100 years.
Nitrous Oxide is 265 times stronger over 100 years.
Disclaimer: This graphic is not to scale and does not represent the size of the different greenhouse gases. It represents a visual comparison of the ability of each gas to trap heat in the atmosphere.