On this page:

Victoria’s water sector, including water corporations, are committed to:

  • being leaders on climate change action
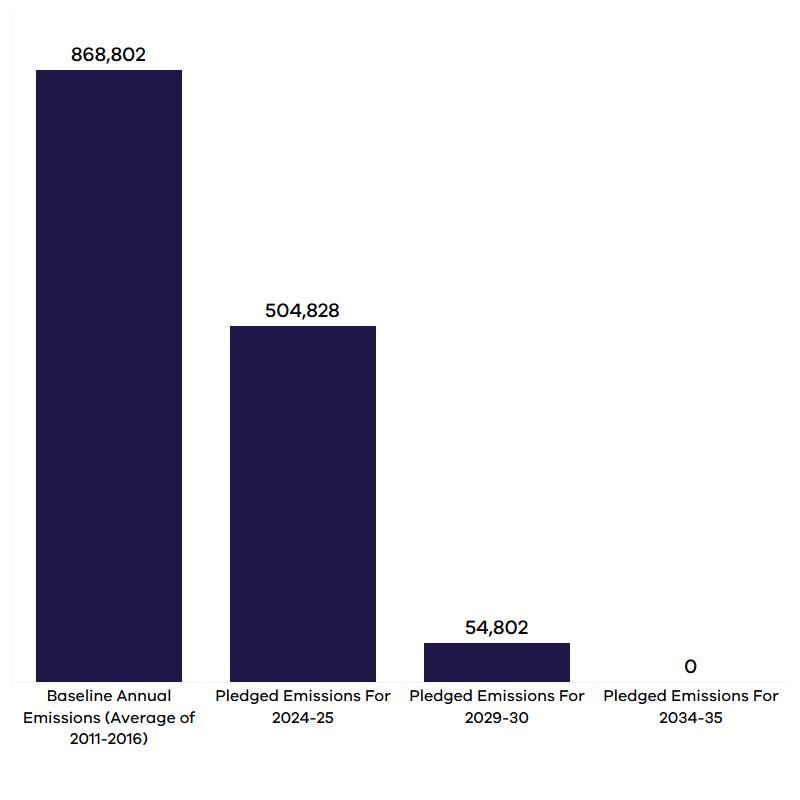
  • reducing greenhouse gas emissions to net-zero by 2035
  • adapting to climate change impacts
  • investing in best practice climate science
  • ensuring the sector can make good decisions as the climate continues to change.

You can learn more about how Victoria's water sector is taking action in the Five-year Water Cycle Adaptation Action Plan 2022-2026 and the Statement of Obligations (Emission reduction).

Reducing greenhouse gas emissions

Pledged emissions bar graph for water corporations in Victoria. Baselines annual emissions (average 2011-16: 868,802, 2024-25: 504,828, 2029-30: 54,802, 2034-35: 0
Reducing greenhouse gas emissions

Pledged emissions bar graph for water corporations in Victoria.

Baselines annual emissions: average 2011-16: 868,802

Pledged Emissions for 2024-25: 504,828

Pledged Emissions 2029-30: 54,802

Pledged Emissions: 2034-35: 0

Pledged emissions reductions timeline for water corporations

Water corporations are investing in new projects to:

  • improve energy efficiency
  • use more renewable electricity
  • switch to low or zero emissions vehicles
  • produce clean energy from waste.

These projects result in:

  • job creation
  • reduction in water corporation's electricity and operating costs
  • helping to protect our environment.

The water sector is responsible for the largest proportio of government emissions

Figure 2.1. The water sector is responsibile for the largest porportion of government emissions. Blue ring divided into percentages representing the breakdown of the water sector responsible for government emissions.  Water infrastrucutre 24%, 1 wastewater, 2 supply, 3 other. Rail 19%, School 8%, Universities 12%, Healthcare 18%, Other government 19%. Note tht data used to generated this figure is largley indicative and based on esitmates using the best available data for the purpose of comparison.
The water sector is responsible for the largest proportio of government emissions

The water sector is responsible for the largest proportion of government emissions.

The blue ring is divided into percentages representing the breakdown of the water sector responsible for government emissions.

  • Water infrastructure 24%
    • 1 wastewater
    • 2 supply
    • 3 other
  • Rail 19%
  • School 8%
  • Universities 12%
  • Healthcare 18%
  • Other government 19%.


Note that the data used to generate this figure is largely indicative and based on estimates using the best available data for the purpose of comparison.

Download The water sector is responsible for the largest proportio of government emissions

Each water corporation is different. That is why each water corporation has its own emissions reduction targets.

You can find your water corporation’s emissions reduction targets in the Statement of Obligations (Emission Reduction).

Statement of Obligations (Emission Reduction)

You will also find more information on water corporations emission reduction projects on their websites and in their annual reports.

Strong action to adapt to the impacts of climate change

The water sector is committed to being a climate action leader. Adapting to climate change impacts, so that it can continue to provide reliable water services for all Victorians.

Pilot Water Sector Adaptation Action Plan (2018-2022)

Under the Pilot Water Sector adaptation Action Plan, the water sector completed 20 projects. Further strengthening the sector's ability to adapt to climate change. New resources were developed to help the water sector make informed decisions on how to deliver reliable water services under a changing climate.

Pilot Water Sector Climate Change Adaptation Plan 2018-2021

The Water Cycle System Adaptation Action Plan (2022-2026)

The Water Cycle System Adaptation Action Plan builds on the success of the pilot plan. The water sector is delivering 21 new actions to explore new water sources. It helps make the water sector more resilient to climate impacts. Encouraging and supporting water efficient homes for Victorians.

Water corporations have their own climate change adaptation plans and projects. You will find more information on their websites and in their annual reports.

Aspects of climate change adaptation for the water sector

Aspects of climate change adaptation for the water sector. Inner ring depicting adaptation aspects, smaller circles with symbols representing resource security, agriculture, business and industry vitality, infratstructure resilience, aboriginal values, social values, environmental outcomes.   Middle ring depicting added pressures, smaller circles with symbols representing population growth, community expectations, chaing economic conditions. Outer ring depicting climate change drivers, smaller circles with symbols depicting sea level rise, reduced water availablity, increased frequency of extreme events, increased temperature.
Water for Victoria 2016
Aspects of climate change adaptation for the water sector

Aspects of climate change adaptation for the water sector.

Inner ring depicts adaptation aspects, smaller circles with symbols representing resource security, agriculture, business and industry vitality, infrastructure resilience, aboriginal values, social values and environmental outcomes.

The middle ring depicts added pressures, smaller circles with symbols representing population growth, community expectations, and changing economic conditions.

Outer ring showing climate change drivers, smaller circles with symbols depicting sea level rise, reduced water availability, increased frequency of extreme events and increased temperature.

Aspects of climate change adaptation for the water sector

Page last updated: 08/09/23