Healthy communities supported by safe, affordable, high-quality services and resilient environments.
The urban water sector provides Victoria’s cities and towns with: safe and secure drinking water, manages and treats wastewater, and helps protect the urban environment from floods.
Water corporations are expected to participate in Integrated Water Management Forums to work with community, local government, catchment management authorities and Traditional Owners on regional priorities that have liveability benefits.
Cross-government cooperation on water management helps create water sensitive and climate resilient cities, healthy people, landscapes and bays.
Water's role in resilient and liveable cities and towns
Water for Victoria 2016
Water's role in resilient and liveable cities and towns
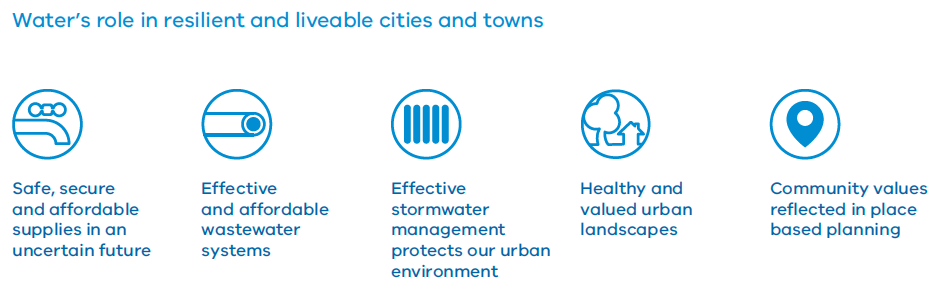
Water’s role in resilient and liveable cities and towns
Left to right icons:
Safe, secure and affordable supplies in an uncertain future
Water's role in resilient and liveable cities and towns
Liveability also includes affordability and support for vulnerable customers, so it is important that water corporations maintain downward pressure on prices and lower water bills.
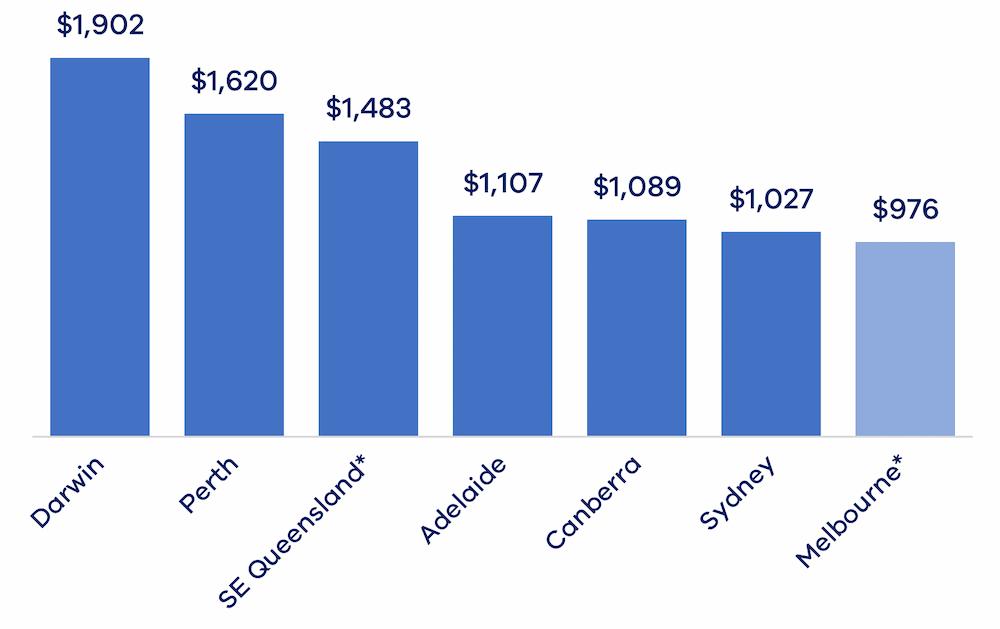
The average household bill for Water and Sewerage usage for major urban centres during the financial year 2021-2022.
Average household bills 2021 - 2022 for major urban centres
Water corporations performance data set, Bureau of Meteorlogy 2022
Average household bills 2021 - 2022 for major urban centres
The average household bills for Water and Sewerage for major uban centres during the financial year 2021-2022.
Note: No data was available for Hobart. Data is only available on an aggregated basis for the for the whole State of Tasmania.* Weighted retail utility average.
Average household bills 2021-2022 for all major urban centres.
Average residential bills across major urban Centres.
Darwin has the highest average bill, whereas Melbourne has the lowest.
Average household bills 2021 - 2022 for major urban centres
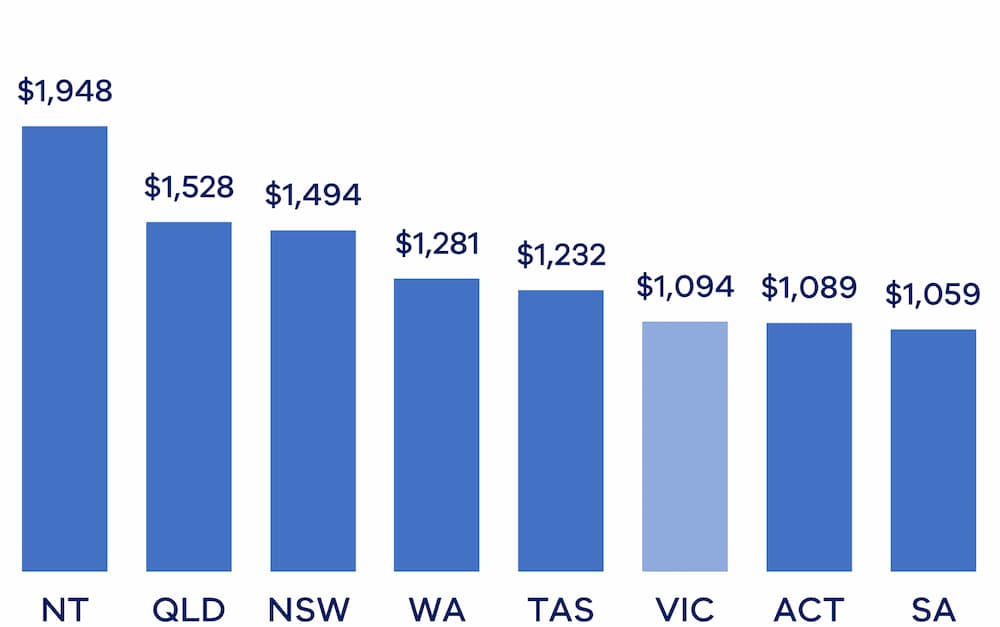
The average household bill for Water and Sewerage for all urban areas for each State during the financial year 2021-2022.
Note: No data is available for Hobart. Data is only available on an aggregated basis for the for the whole State of Tasmania. *Weighted retail utility average.
Average household bills 2021 - 2022 for all urban areas
Water corporations performance data set, Bureau of Meteorology 2022
Average household bills 2021 - 2022 for all urban areas
The average household bill for Water and Sewerage for all urban areas for each State during the financial year 2021-22.
Average household bills across all urban areas.
NT $1,948
QLD $1,528
NSW $1,494
WA $1,281
TAS $1,232
VIC $1,094
ACT $1,089
SA $1,059
The average household bill for water and sewerage for all urban areas for each state during the financial year 2021- 2022.
We’ll keep this page updated with progress on creating efficiencies and maximising the benefits for all users from the way we manage our water resources.
There will also be a continued focus on affordability and supporting vulnerable customers. By communicating clear performance information from across the industry, the government can ensure that the Victorian water sector is providing the best possible service to the community.